


US Dollar Talking Points:
- The US Dollar set another fresh yearly high on the heels of this morning’s ECB rate decision.
- The US Dollar remains as one of the strongest currencies in the world as expectations continue to build for the Fed to take some very hawkish action in the coming months. The other side of that argument is how well will stocks be able to hold up but, so far, equities have held support even as we get closer and closer to that May rate decision.
- The analysis contained in article relies on price action and chart formations. To learn more about price action or chart patterns, check out our DailyFX Education section.

The US Dollar set another fresh yearly high this morning but the source of the move was actually the European Central Bank. The ECB took on a dovish tone as they’ve been known to do and this prodded a fast and aggressive move of EUR/USD weakness and, as I highlighted on Tuesday, the two currencies are so linked that it’s unlikely that the Dollar will go very far without at least some participation from the Euro.
Well, this morning was a Euro-fueled move that helped the USD to set another high as EUR/USD dug into a massive spot of long-term support. All the more interesting is the fact that the USD had actually pulled back yesterday, it’s first red day in ten trading days and the first since April had opened. But this morning’s rate decision brought USD bulls back to the table in a very big way and the daily chart is currently showing as an outside day as today’s candle has taken out both the high and the low from yesterday’s pullback.
US Dollar Daily Price Chart
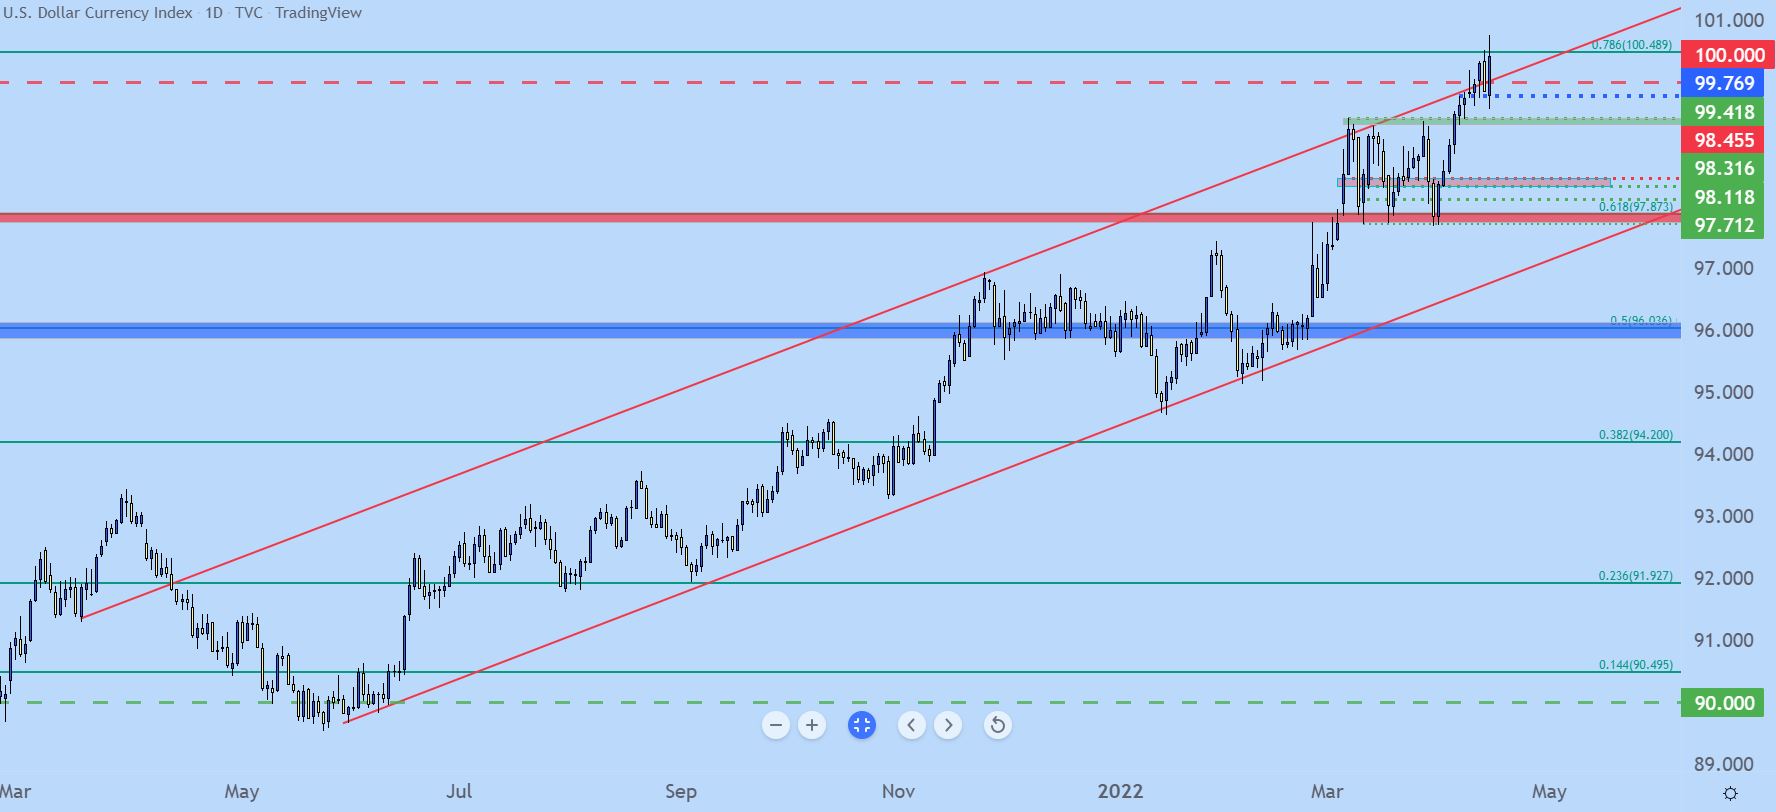
Chart prepared by James Stanley; USD, DXY on Tradingview
US Dollar Shorter-Term
I had written on Tuesday that the US Dollar was due a pullback and that’s precisely what showed up on Wednesday. There was even some attractive construction in that move as prices pulled back, breached a series of lows and found support at around the 99.62 level that I looked at just a couple of days ago.
But that move then led to a sharp bounce up to a fresh high, so it would appear that bulls didn’t want to wait around for much longer. But, there is a deeper zone of support that remains of interest and for long-term bullish trend composition, it seems more beneficial for this area to come into play as some element of support for longer-term themes.
This zone is prior resistance from the March range. This runs from the Fibonacci level at 99.34 up to the swing-high at 99.41. That’s very nearby that prior low of 99.62, however, and given today’s outside bar, corresponding pullbacks could also be fairly large, so I wanted to add a couple of additional supports that may come into play in the event that we did get a larger pullback. The approximate mid-point of the prior March range is around 98.67, and below that we have range support from Fibonacci levels at 97.72-97.87.
US Dollar Four-Hour Price Chart
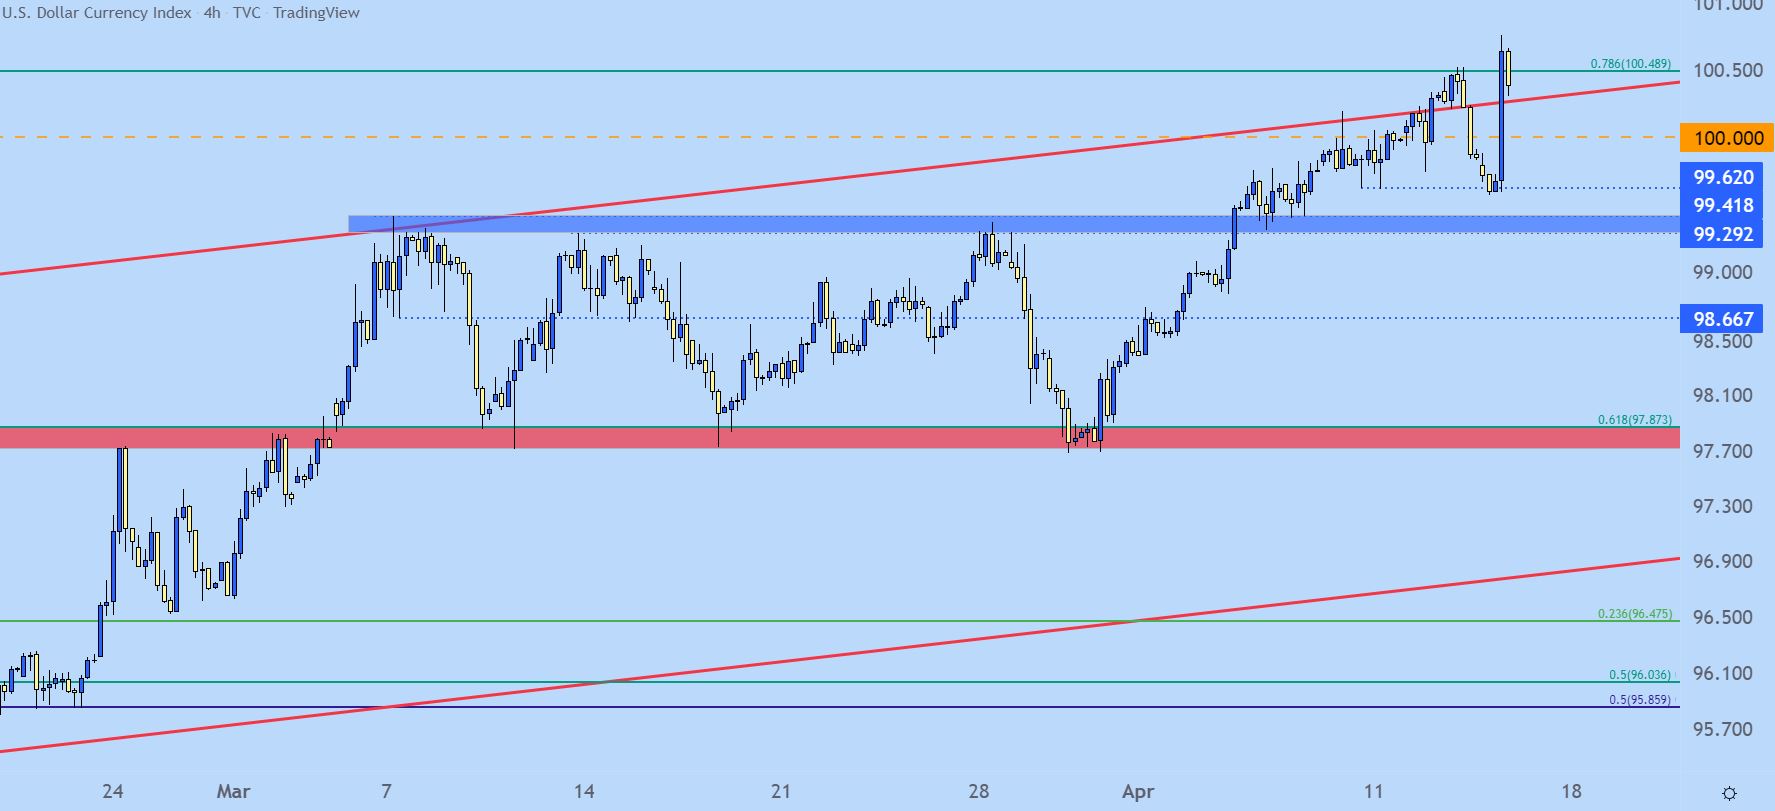
Chart prepared by James Stanley; USD, DXY on Tradingview
EUR/USD Tests a Big Zone of Long-Term Support
Pointing back to that prior statement, if we are going to see the US Dollar rip to fresh highs we’re likely going to need to see EUR/USD drive deeper into a long-term zone of support. This zone starts from around the 1.0814 Fibonacci level which had come into play to hold the lows in early-March before a 370 pip incline.
This morning saw some deeper drive into that support zone but we’re nearing some key points on the chart that were in-play around the pandemic lows. There’s a possible swing around 1.0727 and another at 1.0638.
This can be an especially tricky place to trigger fresh bearish exposure, especially considering where the US Dollar is in its own trend, with both currencies being fairly stretched at the moment.
EUR/USD Weekly Price Chart
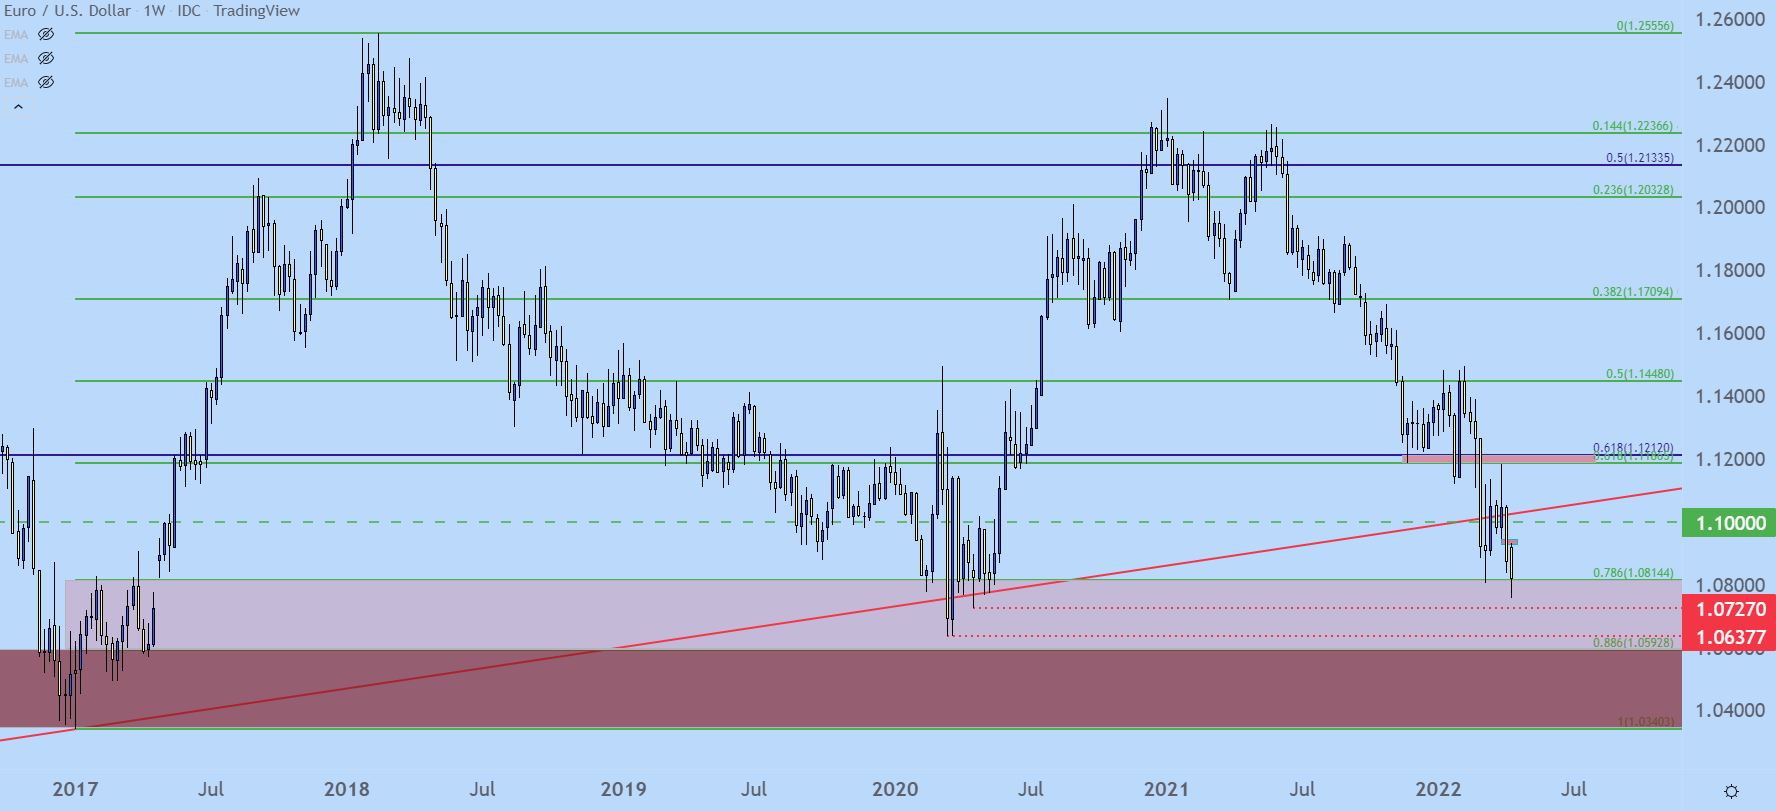
Chart prepared by James Stanley; EURUSD on Tradingview
EUR/USD – How to Proceed with a Stretched Market?
At this point, with EUR/USD hanging around in this long-term support zone, triggering short and hoping for continuation can be a difficult way of proceeding with matters.
But, there’s still the possibility of greater breakdown and that’s what EUR/USD bears are likely going to be looking for. So, rather than chasing and hoping, traders can look to institute breakout logic with such scenarios, which we talk about in the guide below.

Alternatively, traders can look to implement trend strategies in the pair but like USD above, if a pullback does show up given the large move today, the pullback could also be correspondingly large. But, there are a number of prior support points that remain of interest for such an approach. The zone around 1.0930-1.0941 is very nearby, and the 1.1000 psychological level is above that which, notably, hasn’t shown much for resistance since the April sell-off got started.
EUR/USD Daily Price Chart
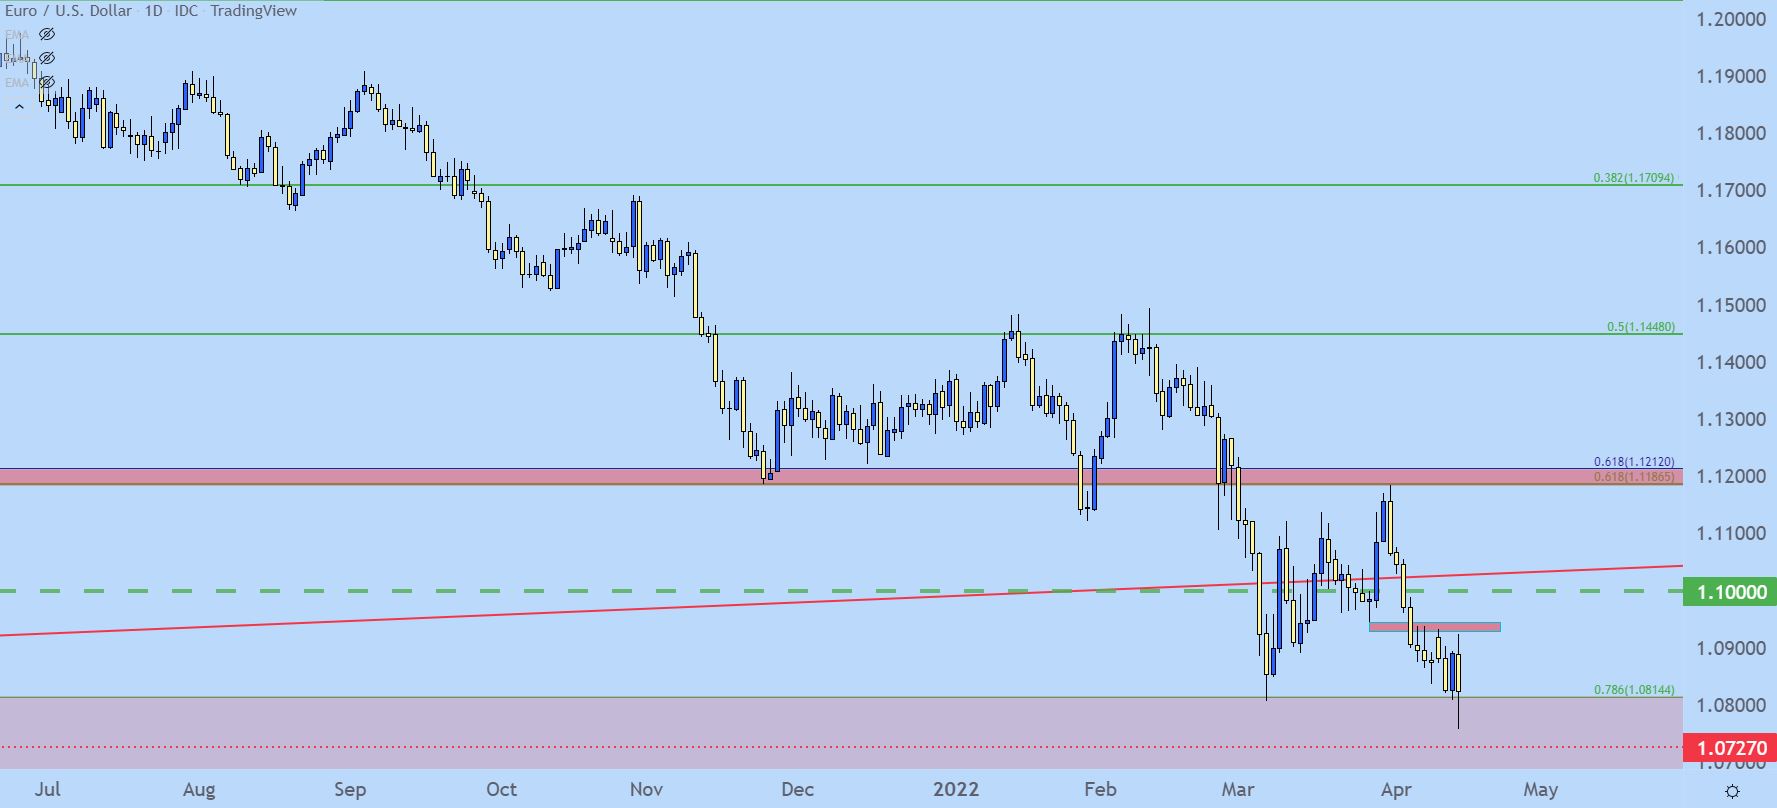
Chart prepared by James Stanley; EURUSD on Tradingview
GBP/USD
On Tuesday I highlighted pullback potential in GBP/USD, largely on the basis of the pair showing unwillingness to sustain a break below the 1.3000 psychological level.
As USD pulled back yesterday, GBP/USD broke out and the pair moved beyond the resistance levels that I was tracking. And at this point, there may even be scope for some additional gains. So GBP/USD may have more rip in store before being able to break-down below that 1.3000 level in GBP/USD.
On the below four-hour chart I’ve pointed out a couple of additional topside levels that could become of interest. The 1.3145 level caught this week’s high and above that, another spot exists around 1.3195. Above that, 1.3273 is something that might only come into play if USD stretches all the way back to that March support, which is not something that I’m expecting but, again, given the outside day and the massive move we have to open up the realm of possibilities here.

GBP/USD Four-Hour Price Chart
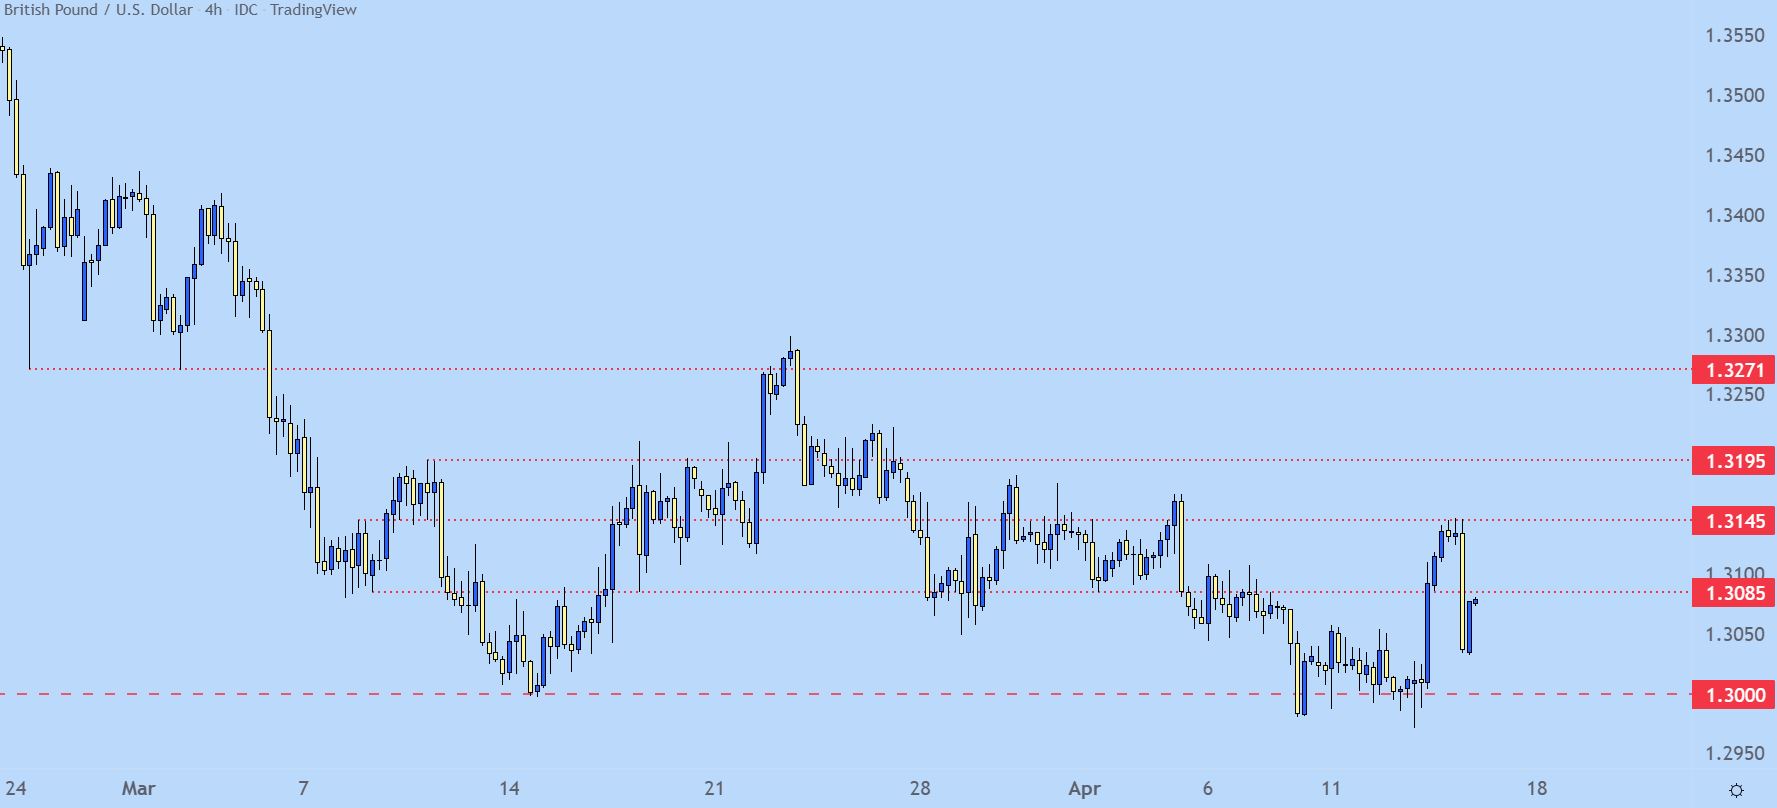
Chart prepared by James Stanley; GBPUSD on Tradingview
AUD/USD Getting Warmed Up for Pullback?
Since early-February I’ve focused short-USD approaches on AUD/USD. Early-Feb is when the pair was basing support off of the .7000 big figure while also brewing up a falling wedge, and that formation began to give way later in the month. March was largely an outing of strength for the pair as it flew all the way up to the .7650 level.
More recently, however, the pair has been showing signs of pullback. From the Daily chart below, we can see where AUD/USD has spent the past four trading days holding support around the .7417 Fibonacci level. And then reading in between the lines, there’s a non-completed evening star formation showing on the chart.
This can keep the focus on the short-side of the pair, looking for a push back down towards the .7331 Fibonacci level or perhaps even as deep as the .7290 area of prior resistance.

AUD/USD Daily Price Chart
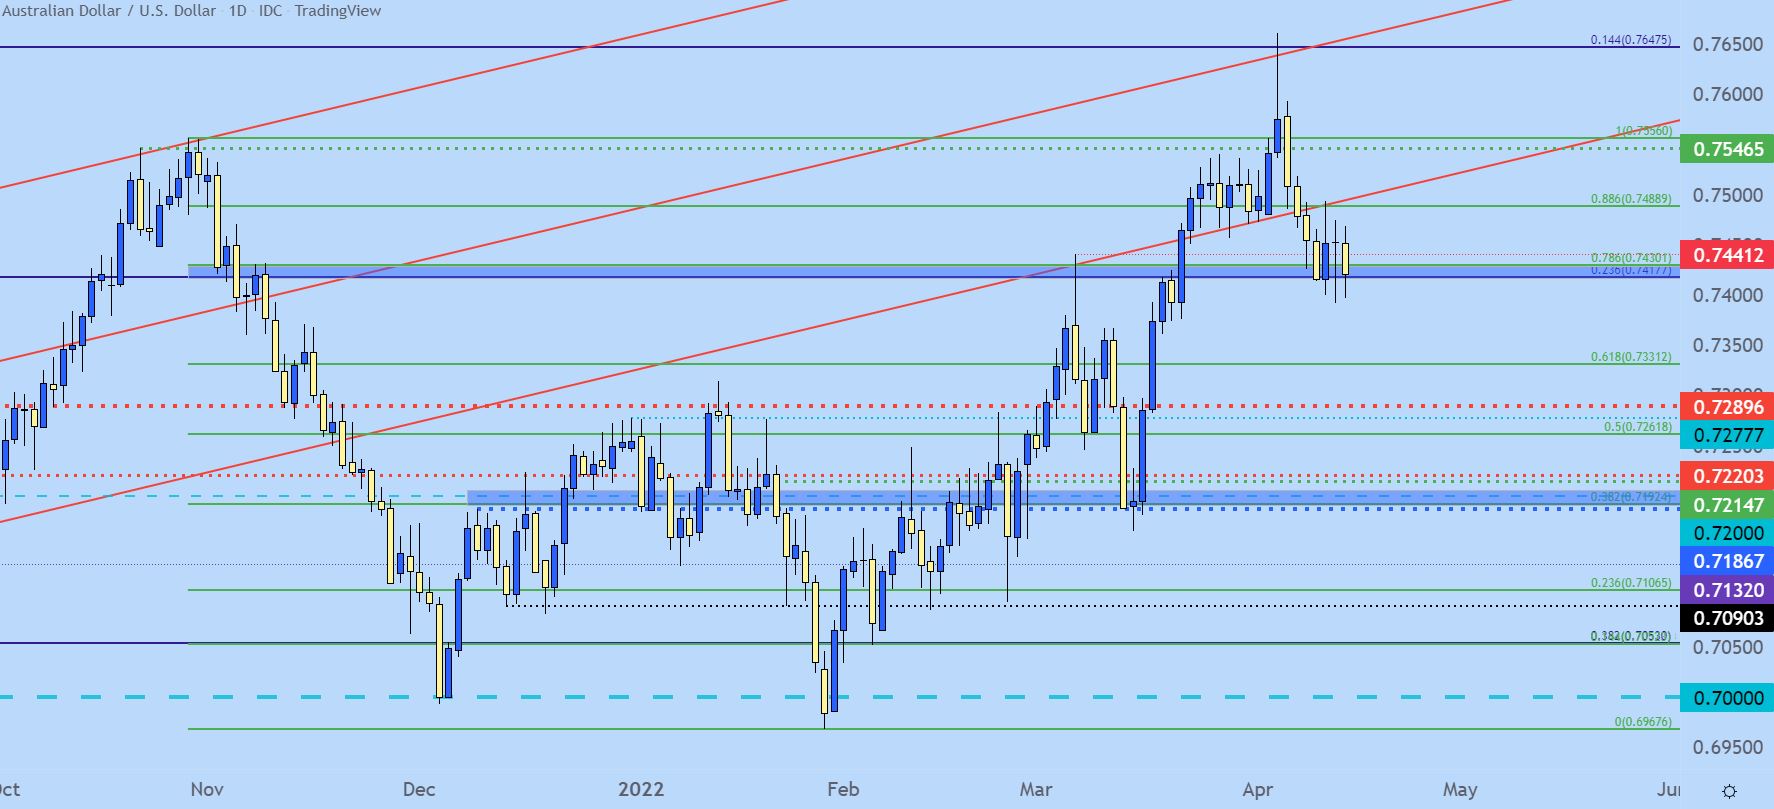
Chart prepared by James Stanley; AUDUSD on Tradingview
USD/JPY
The big event around the US Dollar this week was USD/JPY setting a fresh 20-year high. And this is at a highly contested spot on the chart that snapped bulls back in 2015 when it came into play a few years after Abe-nomics kick-started the trend.
USD/JPY Monthly Price Chart
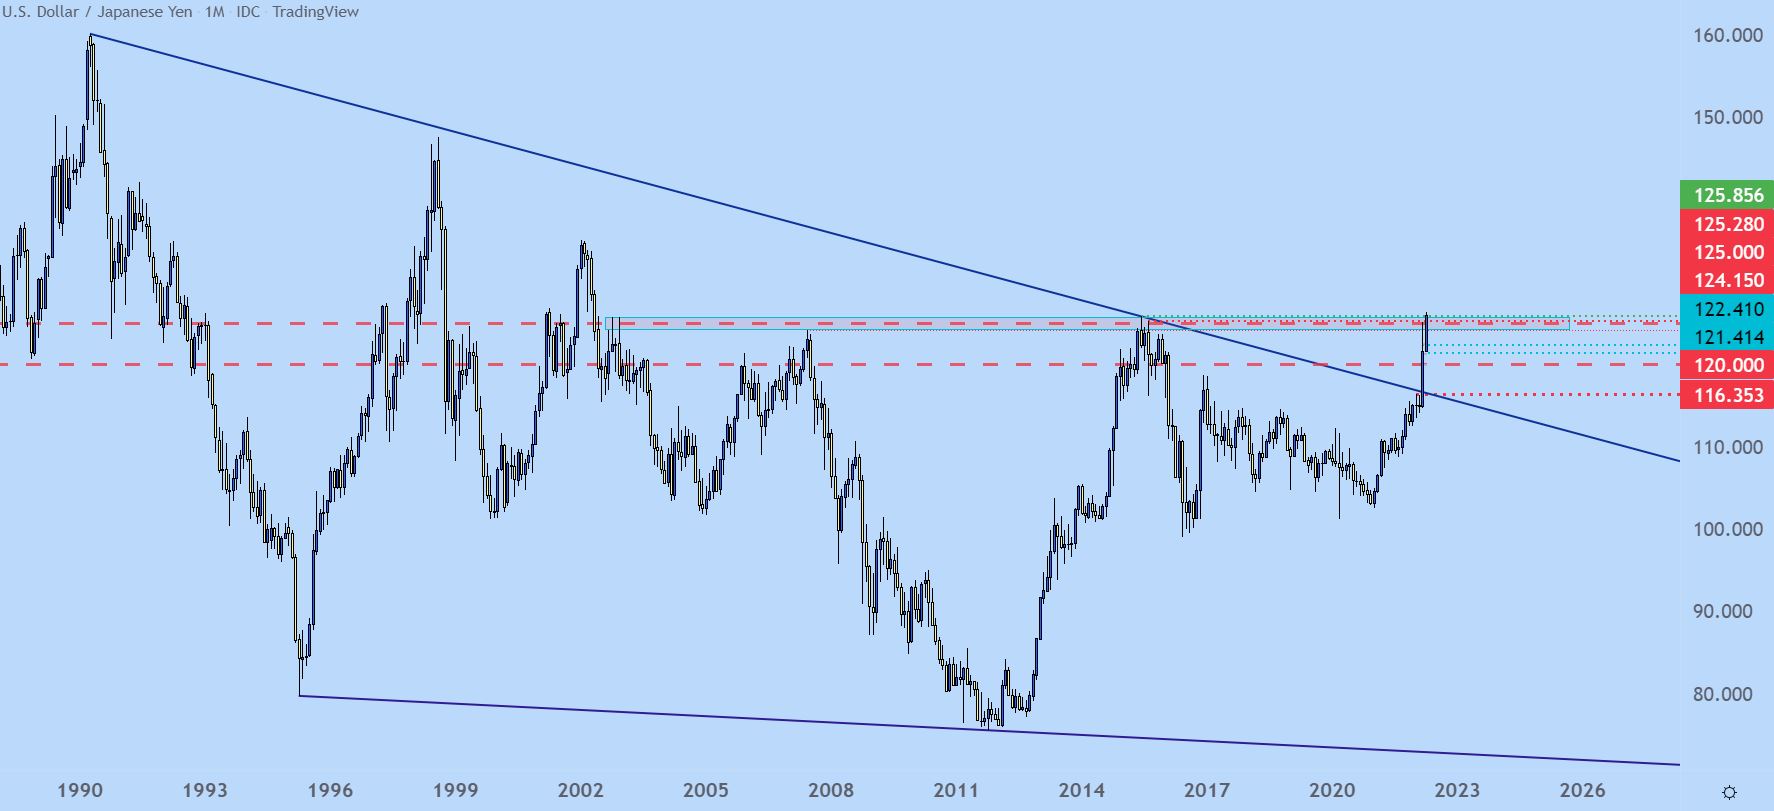
Chart prepared by James Stanley; USDJPY on Tradingview
USD/JPY broke above that resistance on Wednesday and saw some follow-thru drive on Thursday; but this is an area where it could be difficult to bring fresh buyers into the matter and that exposes the pair for pullback potential.
We saw something similar in late-March, just after the pair tagged the 125.00 psychological level. And that led to a 380-pip pullback before support finally showed up at 121.41, leading to another extension in the trend.
At this point, I would be partial towards looking at a pullback but I’d be very cautious of calling this a full-fledged reversal candidate as we’re likely going to need to see something from either the BoJ or the Fed before that becomes a workable theme. But, given the veracity of the move it wouldn’t surprise me to see something like that show up before too long.
For near-term levels in USD/JPY, 125 remains of interest but that’s already been pretty well-trafficked for support. Below that, the 124.15 level remains attractive to me. And if that can’t hold the lows and if we do get a greater pullback, the same 122.41 level remains of interest as an ‘s3’ spot of support.

USD/JPY Four-Hour Price Chart
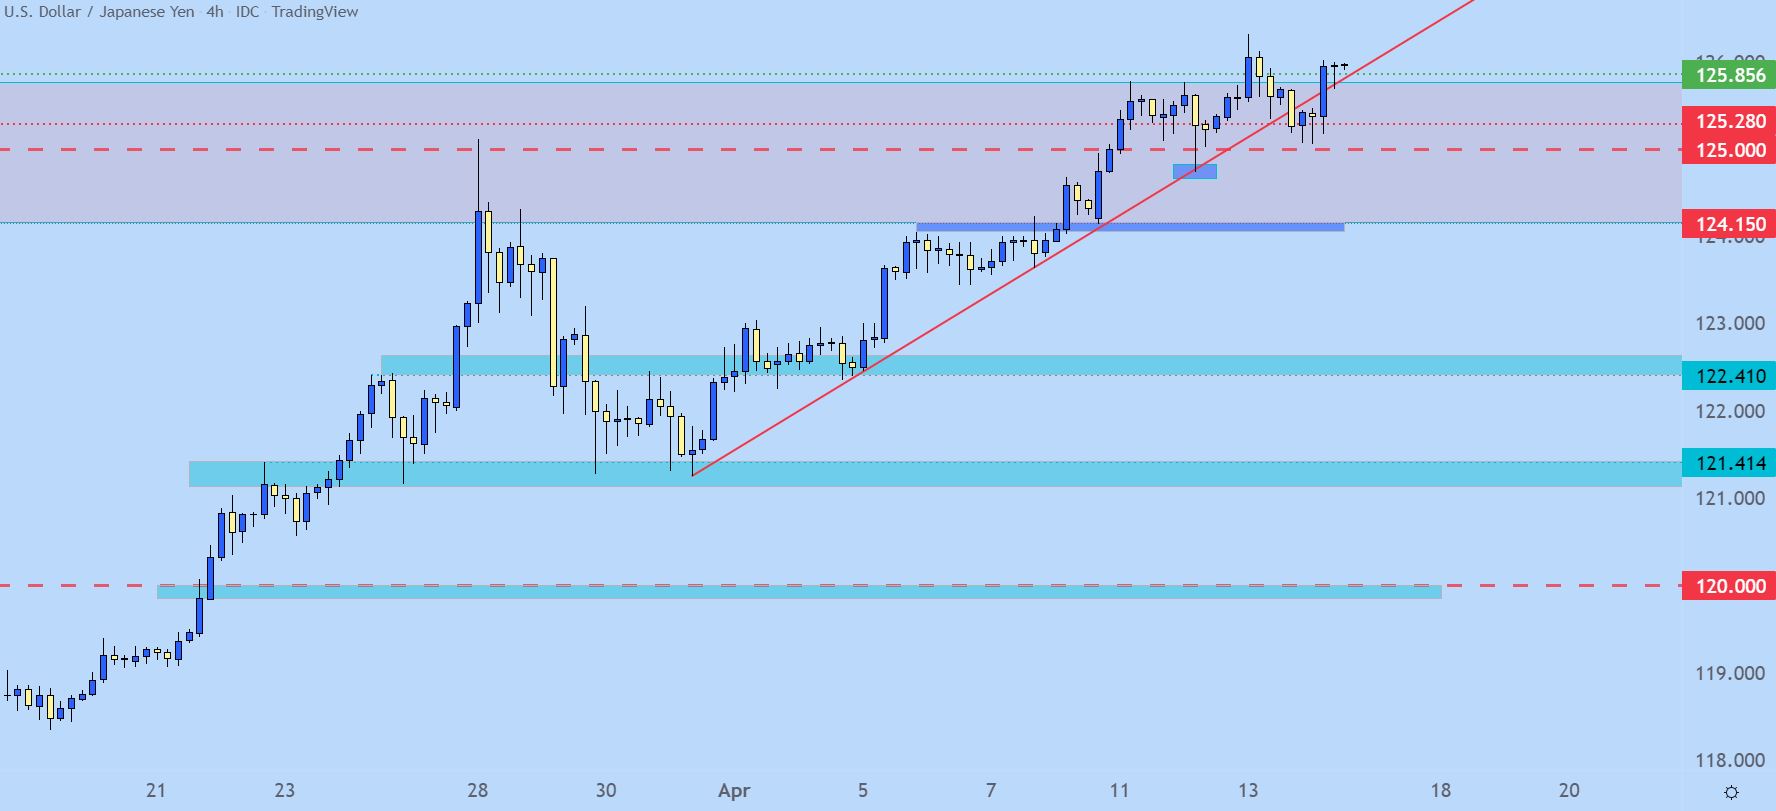
Chart prepared by James Stanley; USDJPY on Tradingview
--- Written by James Stanley, Senior Strategist for DailyFX.com
Contact and follow James on Twitter: @JStanleyFX


