


US Dollar, EUR/USD, GBP/USD, USD/JPY, GBP/JPY Talking Points:
- The Q2 theme of US Dollar weakness continues in a very visible manner.
- This USD theme has helped to create swells in both EUR/USD and GBP/USD, and USD/JPY has snapped back to a big support level.
- The analysis contained in article relies on price action and chart formations. To learn more about price action or chart patterns, check out our DailyFX Education section.
The US Dollar continues to fall, furthering the Q2 theme that’s become a bit more visible over the past few days. This is what I was at in the Q2 Technical Forecast for the US Dollar and, well, it’s very similar to what I was looking for in Q1.
In both forecasts I kept the US Dollar to a bearish reading. But coming into Q1 I warned that the US Dollar was primed for a counter-trend move that may last through the first quarter and, perhaps even the first half of the year. This came from the fact that the US Dollar had moved into a deep oversold state around the end of last year, and there was a falling wedge formation that had shown up, often followed with the aim of bullish reversals.

If we combine that with a really big level coming into play around the lows around the 90.00 level, and there was multiple motives for prices to pull back. Nonetheless, given the veracity of the prior bearish trend, I retained a bearish reading for Q1, and Q2, as well, as it looked as though bears would ultimately prevail.
Just a few weeks into Q2 and bears are making their presence known. From the Daily chart below, we can see USD setting a fresh four-month high on the final trading day of Q1, after which we’ve seen a far different tone in the currency.
US Dollar Daily Price Chart
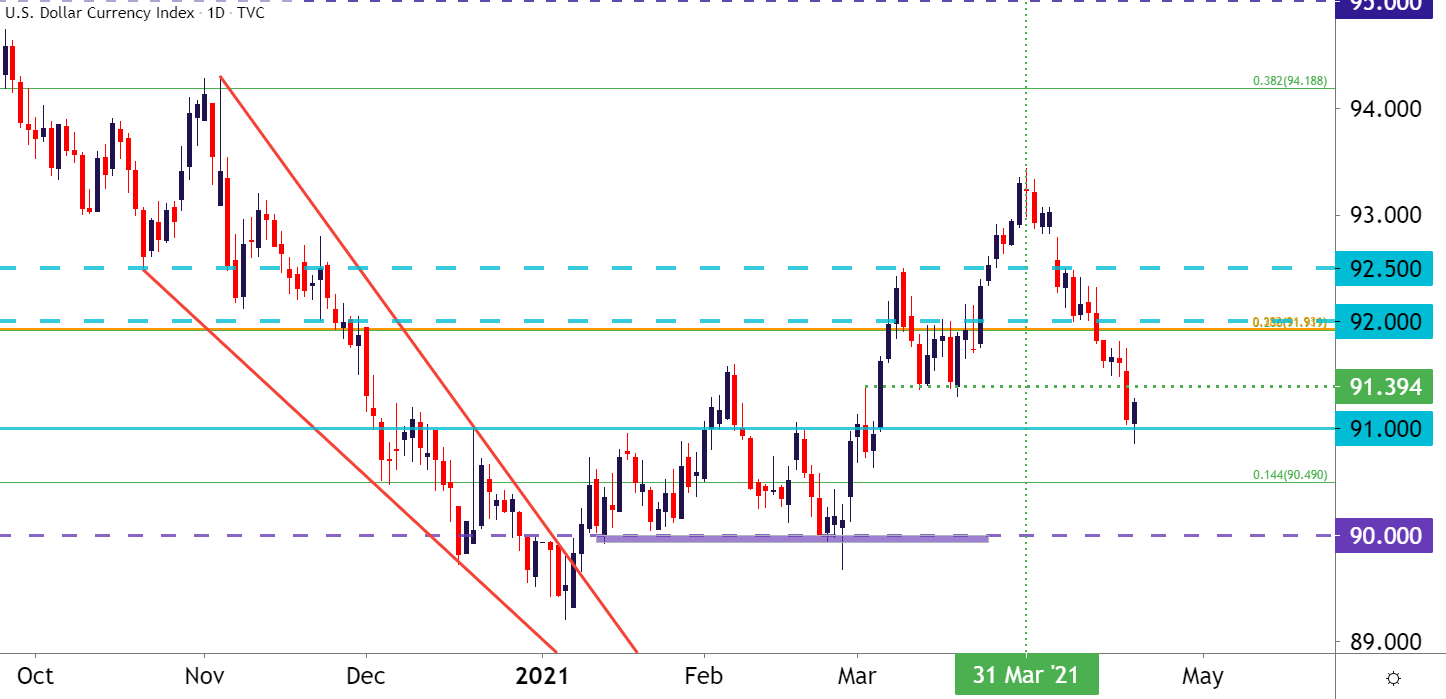
Chart prepared by James Stanley; USD, DXY on Tradingview
US Dollar Longer-Term
It’s the longer-term chart that’s compelling here, and below I’m looking at the same chart that I had shared in the Q2 forecast. This is of the monthly variety, and it helps to put that Q1 strength into scope. The four-month high that printed just a few weeks ago actually came-in around the underside of a bullish trend channel. Support at the beginning of the year plotted around the 89.92 Fibonacci level, which is confluent with the 90 psychological level.
To learn more about Fibonacci, join us in DailyFX Education
US Dollar Monthly Price Chart

Chart prepared by James Stanley; USD, DXY on Tradingview
EUR/USD Bullish Potential
Going along with that re-emergence of weakness in the USD has been a similar re-emergence of strength in EUR/USD. The pair just broke above a key spot of resistance at 1.1965-1.2000. This now opens for the possibility of bullish continuation, and that prior spot of resistance becomes an interesting area to look for that next spot of higher-low support.
EUR/USD Four-Hour Price Chart
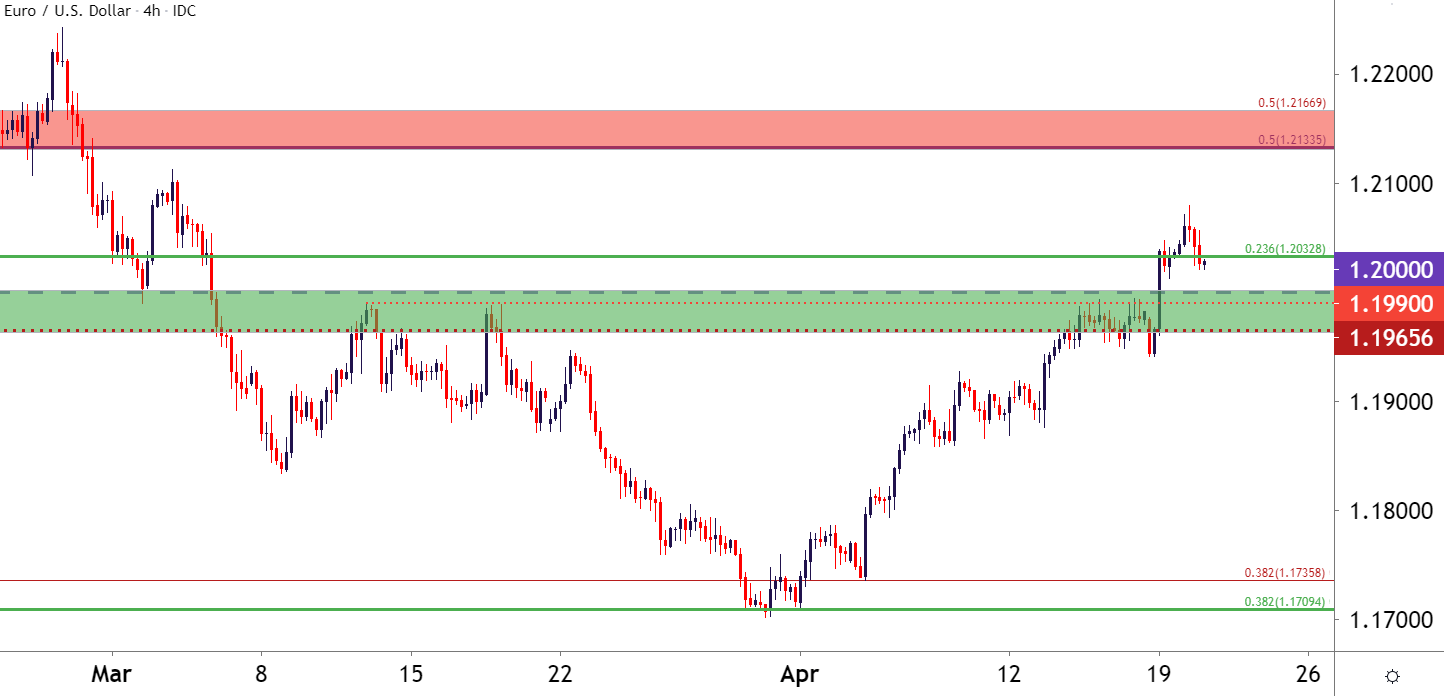
Chart prepared by James Stanley; EURUSD on Tradingview
GBP Explodes, GBP/USD Rebuked at 1.4000
Cable bulls must be getting real familiar with that 1.4000 spot. The level rebuked five separate breakout attempts in the first few weeks of March. Eventually bulls backed down and prices trickled back to a confluent spot of Fibonacci support. That zone held two different support tests, and buyers made their mark this week when pushing GBP/USD all the way back up to that 1.4000 spot.
But, again, resistance played in, with an assist from the underside of a bullish channel. At this point, the door can remain open for bullish continuation. Support potential exists around 1.3873; looking for another test and, perhaps even, a break through that 1.4000 psychological level.
To learn more about psychological levels, check out DailyFX Education
GBP/USD Daily Price Chart

Chart prepared by James Stanley; GBPUSD on Tradingview
USD/JPY Snaps Back
Going along with the US Dollar and the reflation themes, USD/JPY had a strong Q1 that’s turning around with aggression so far in Q2. Last quarter and in particular March saw some strong motive in the topside move as USD/JPY took out a major long-term trendline.
USD/JPY Monthly Price Chart

Chart prepared by James Stanley; USDJPY on Tradingview
Of interest for shorter-term analysis, a Fibonacci retracement produced by last years major move (February-March) has provided some very usable information of recent. The 88.6% retracement of that move caught the high at the end of Q1.
And the 61.8% retracement of that move came into play yesterday and, so far, has helped to hold the lows through today. This may provide some bullish potential, but the big drawback here is trying to work reversals in both USD and JPY. Below, I’ll look at another possible avenue.
USD/JPY Daily Price Chart

Chart prepared by James Stanley; USDJPY on Tradingview
GBP/JPY Bullish Channel Support Test
So, threading a few of the above themes together, GBP/JPY may have some near-term interest. The British Pound has been very strong. The Yen, of recent, has been similarly strong after a visible showing of weakness in Q1.
The pair is currently holding in a bullish trend channel that’s been brewing for the past couple of months. The 150.00 psychological level helped to hold those lows, and the quick high from yesterday caught resistance at the mid-point of that bullish channel.
To learn more about trendlines or psychological levels, check out DailyFX Education
GBP/JPY Four-Hour Price Chart
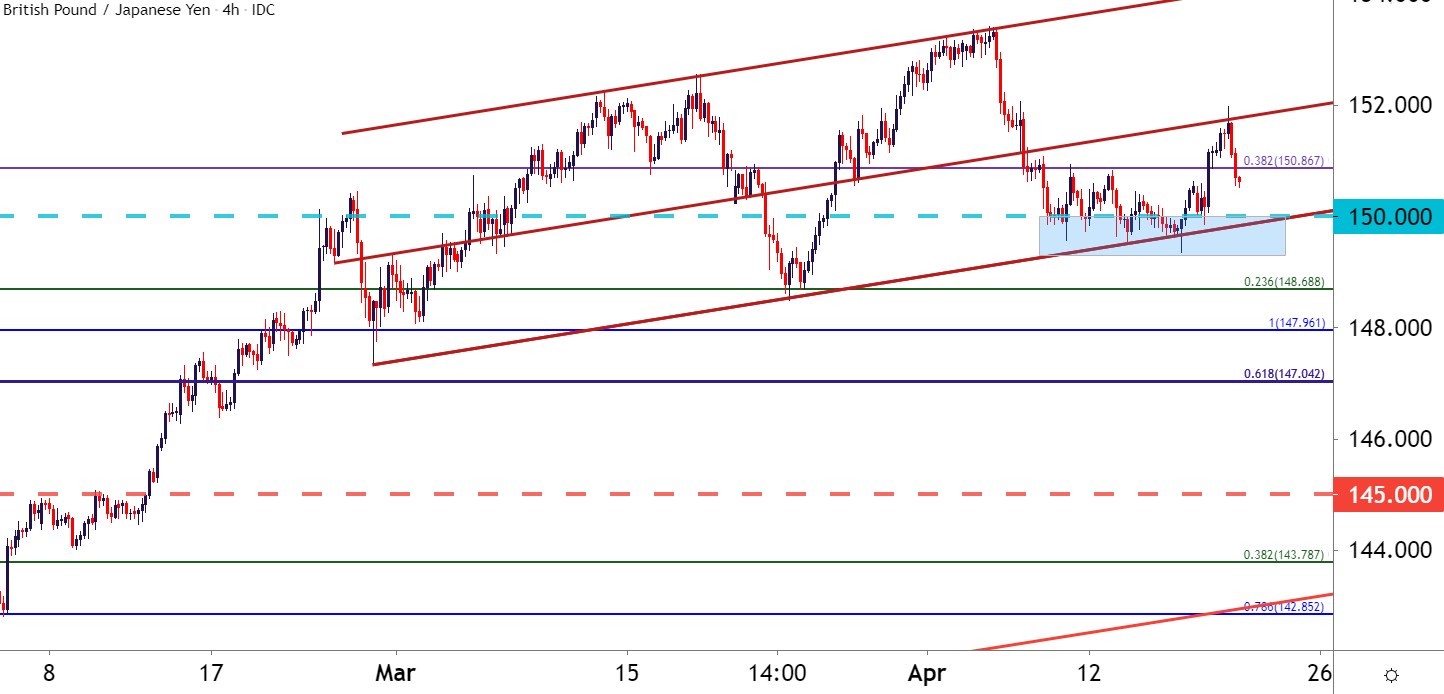
Chart prepared by James Stanley; GBPJPY on Tradingview
--- Written by James Stanley, Senior Strategist for DailyFX.com
Contact and follow James on Twitter: @JStanleyFX


