


US Dollar, EUR/USD, GBP/USD Talking Points:
- The Q2 sell-off in the US Dollar continues as the Greenback continues to peel back Q1 gains.
- EUR/USD and GBP/USD are both testing resistance levels of note, with Cable putting in a massive move to start the week.
- The analysis contained in article relies on price action and chart formations. To learn more about price action or chart patterns, check out our DailyFX Education section.
The US Dollar put in a quick move of weakness to start the week, furthering the Q2 theme that’s seen a large chunk of Q1 gains wiped out. This was a central focus of the Q2 Technical Forecast for the US Dollar, in which I looked at the monthly chart while highlighting the fact that last quarter’s strength looked as though it was a counter-trend move after an oversold US Dollar found support at a long-term Fibonacci level.
The chart below is an updated version of what’s in that Q2 Technical Forecast, and if you’d like to download the report in full, the link below can get that set up:

US Dollar Monthly Price Chart
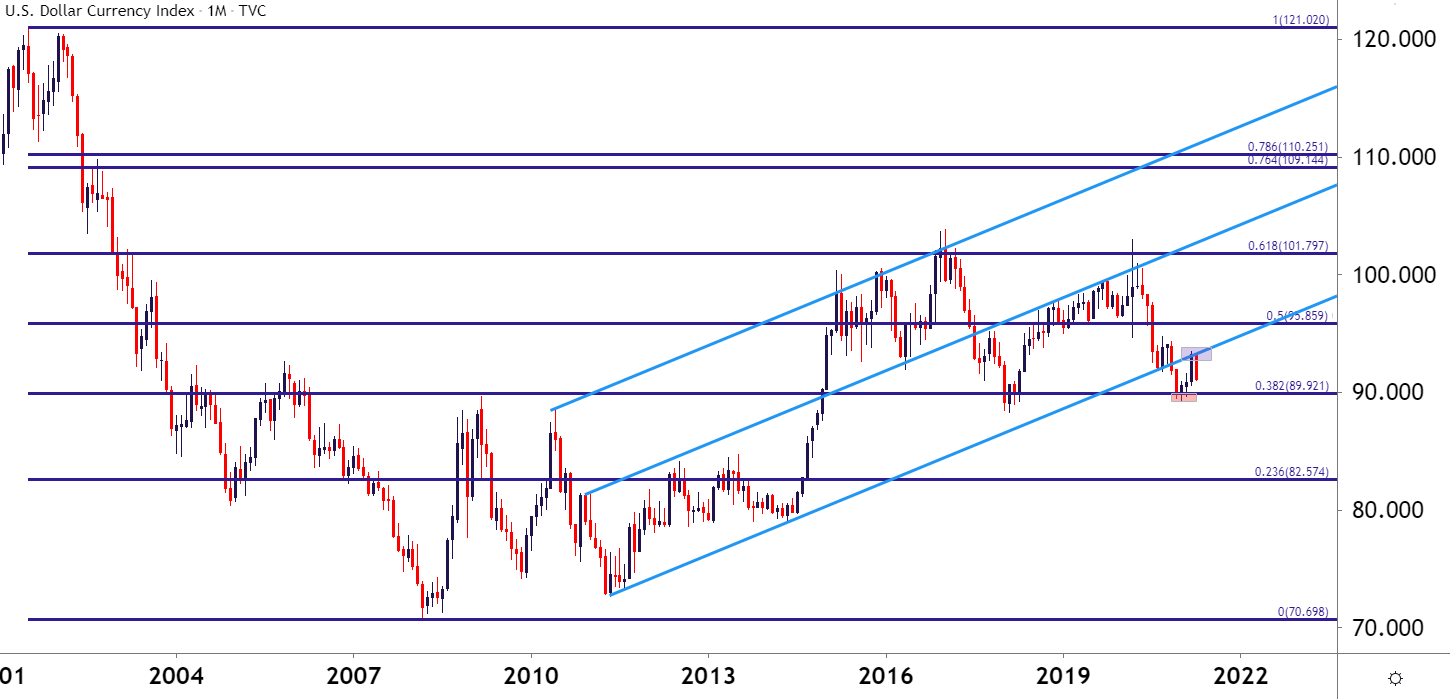
Chart prepared by James Stanley; USD, DXY on Tradingview
On the below weekly chart, we can get a better idea for how this Q2 theme has started to set-in. The US Dollar bottomed in the first week of Q1, after which a grind developed around Fibonacci support in the vicinity of the psychological level at 90.
This confluent support helped to hold the lows, with buyers making their mark in the month of March, helping to push the Greenback up to a fresh four-month-high on the final trading day of Q1.
US Dollar Weekly Price Chart

Chart prepared by James Stanley; USD, DXY on Tradingview
US Dollar Sell-Off Sinks to Fibonacci Support
On the below Daily chart, I’ve added a Fibonacci retracement around that major move in the month of March. Prices have already begun to test the 61.8% retracement of that major move but, for now, it appears this line-in-the-sand is helping to set support. This also highlights the potential for lower-high resistance around that prior batch of short-term support that helped to hold the lows on Thursday and Friday of last week. This plots to around 91.56 on the DXY.
US Dollar Daily Price Chart
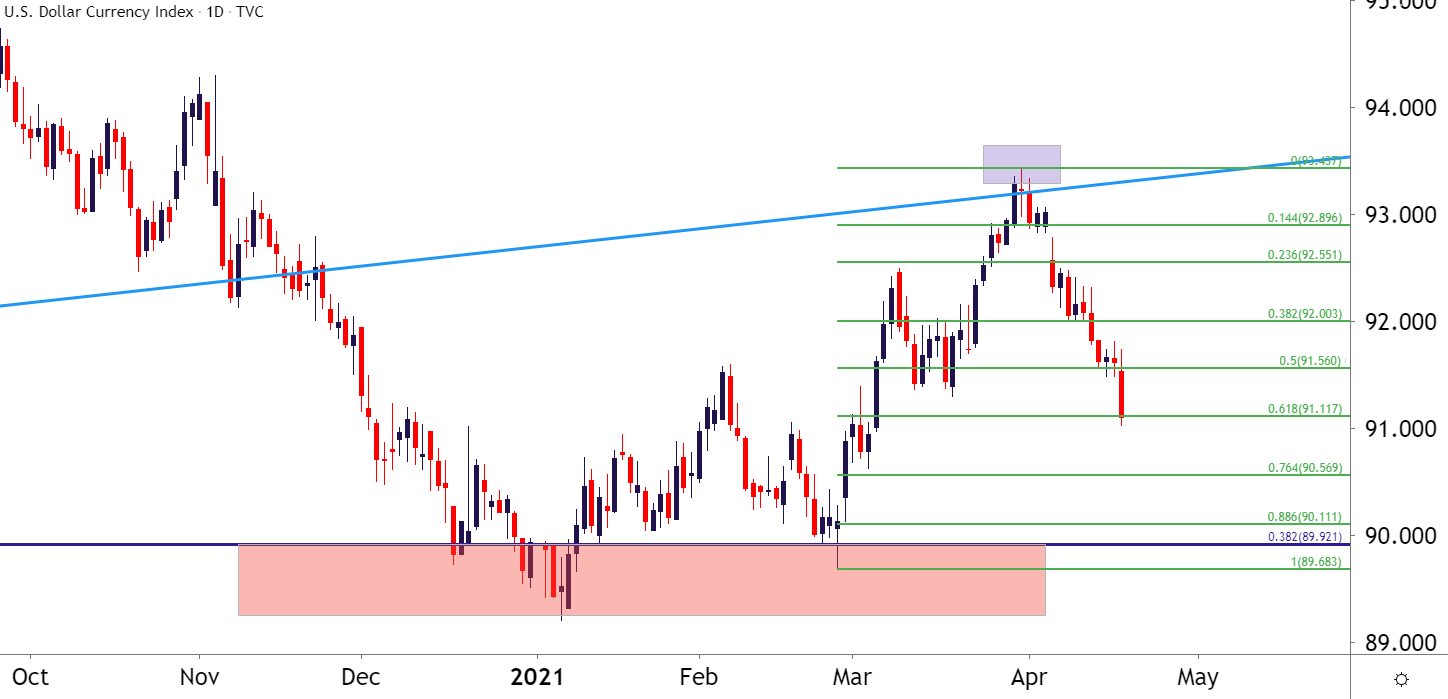
Chart prepared by James Stanley; USD, DXY on Tradingview
EUR/USD Peeks Above 1.2000 – When Might it Peak?
Forgive the pun, I couldn’t help myself. EUR/USD had set up for a test of resistance in the 1.1965-1.2000 area and the pair is staging a breakout to begin the week, testing above the big figure for the first time since early-March. It is difficult to imagine the US Dollar making a concerted move without at least some cooperation from EUR/USD, and given the Euro’s 57% allocation in the DXY US Dollar basket, that makes sense.
At this point, there’s another item of resistance that’s starting to come into play in EUR/USD, and this emanates from the 2017-2018 major move in the pair. The 38.2% Fibonacci retracement from that move is at 1.1709, and this price helped to catch the four-month low around the end of Q1.
The 23.6% retracement of that major move plots just above the 1.2000 handle, at 1.2033. That price is so far helping to hold the highs for today.
To learn more about Fibonacci, join us in DailyFX Education
EUR/USD Weekly Price Chart
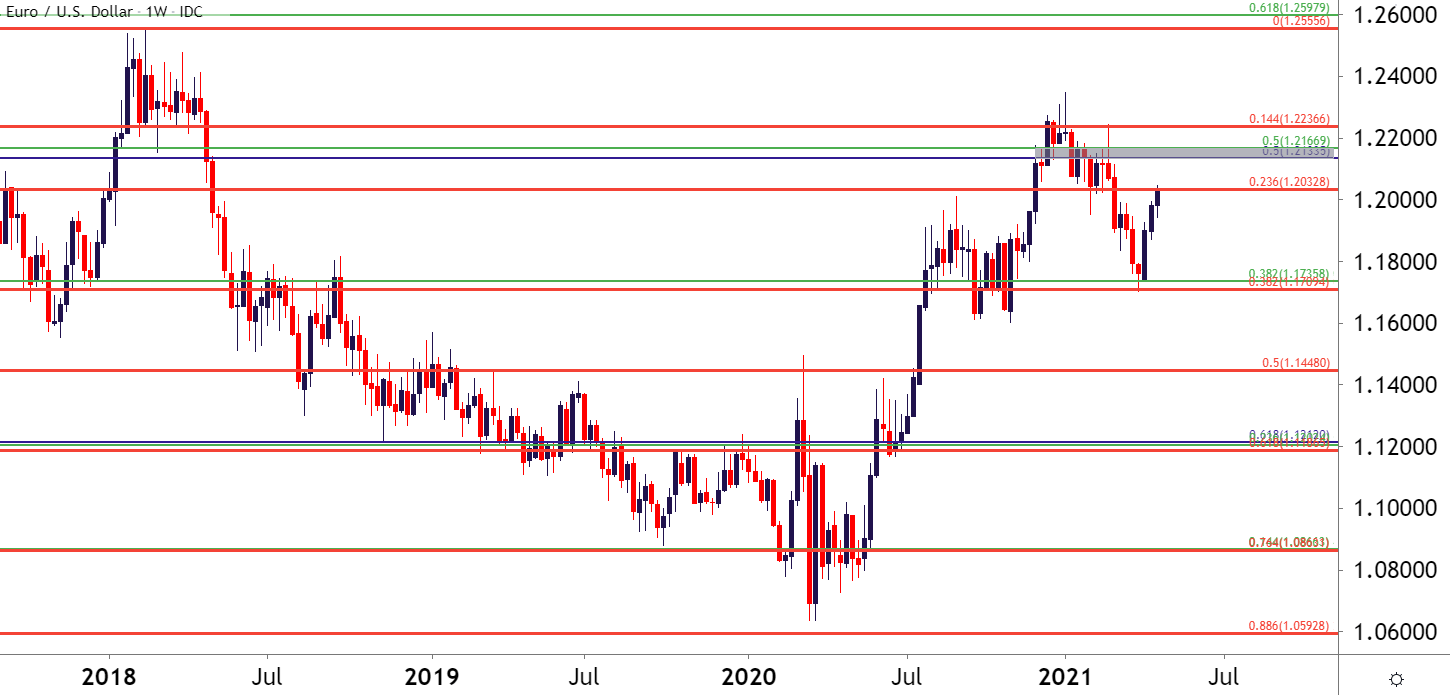
Chart prepared by James Stanley; EURUSD on Tradingview
GBP/USD: Cable Back to the Big Fig
It’s been a big day for the British Pound. Coming into March trade GBP/USD was looking like one of the more consistent major pairs, sticking within a trend channel for most of the previous five months, spanning back to early-September. But that trend broke down later in the month as the USD-surge hastened into quarter-end.
GBP/USD found support at a confluent spot between a couple of long-term Fibonacci levels, and after a couple of tests at that zone prices began to spring-higher. That led into a bullish week, with GBP/USD gaining each day, and that theme has hastened so far this week as the pair is making a strong push up to a big area on the chart.
At this point, price action has begun to test the under-side of that bullish channel, and this is confluent with the 1.4000 psychological level. That’s the same 1.4000 psychological level that rebuked three different bullish advances in early-March. Can buyers take it out this time?
To learn more about trendlines or psychological levels, check out DailyFX Education
GBP/USD Daily Price Chart
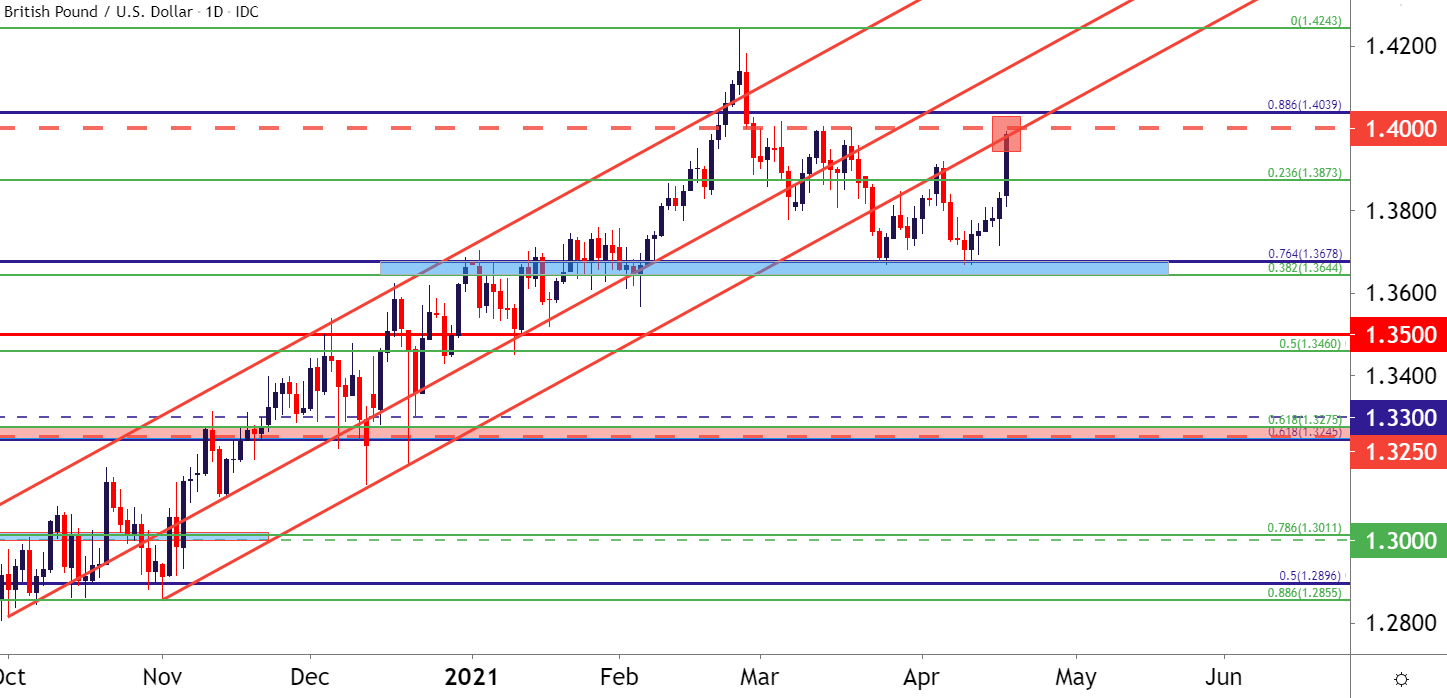
Chart prepared by James Stanley; GBPUSD on Tradingview
--- Written by James Stanley, Senior Strategist for DailyFX.com
Contact and follow James on Twitter: @JStanleyFX


