


British Pound Talking Points:
- GBP continues to trade on its back foot following a really strong outing in Q1.
- EUR/GBP put in a big bullish engulf formation last week, illustrating that GBP weakness.
- The analysis contained in article relies on price action and chart formations. To learn more about price action or chart patterns, check out our DailyFX Education section.
Last week was a rough start to Q2 for the British Pound. Sterling gave up value to all of the US Dollar, the Japanese Yen and even the Euro; and this comes after what most would classify as a ‘strong’ outing for the GBP in Q1 of this year.
To illustrate just how jarring this move was in terms of the prior trend, I’m looking at the EUR/GBP weekly chart below. Last week showed a bullish engulfing candlestick and a stark change-of-pace. The bullish engulf is often followed as a continuation pattern, so in this case – market participants may be looking for the Euro to continue to outpace the British currency. On the EUR/GBP chart below, I’ve identified a possible resistance area ahead, plotted around the 61.8% Fibonacci retracement of the 2020 major move.
To learn more about bullish engulfing patterns, join us in DailyFX Education
EUR/GBP Weekly Price Chart
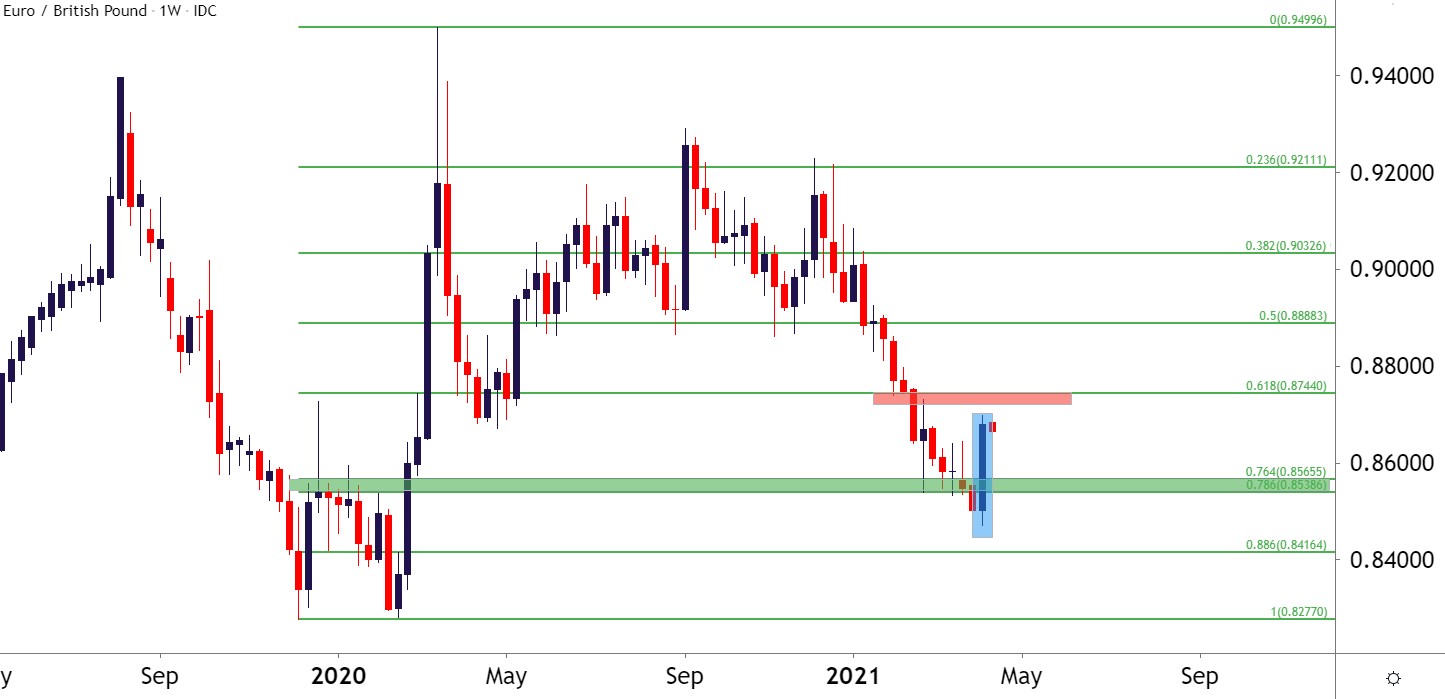
Chart prepared by James Stanley; EURGBP on Tradingview
GBP/USD Bounce from Fibo Support Following Channel Break
Through the first two and a half months of this year, GBP/USD was one of the more attractive USD-setups, largely owed to the consistent trend channel that had set in since last October. Price action continued to scale-up with higher-highs and higher-lows through January and into February, eventually setting a fresh two-year-high. And in late-Feb/early-March, prices began pulling back, but in late-March sellers went on the prowl and finally pushed price action below that bullish trend channel.

Sellers remained in control until a confluent spot of support came into play in late-March, and that same zone came into the equation again last week when sellers re-engaged to elicit a re-test. This is a big spot as there’s the 76.4% retracement of the 2018-2020 major move along with the 38.2% retracement of the September-February move. This confluent zone was resistance-turned-support in January and it’s back again to help currently carve out the lows. Below this zone, the 3460-3500 area on the chart holds some attraction for the next possible support zone should sellers push for a breach of current support.
To learn more about Fibonacci, check out DailyFX Education
GBP/USD Daily Price Chart
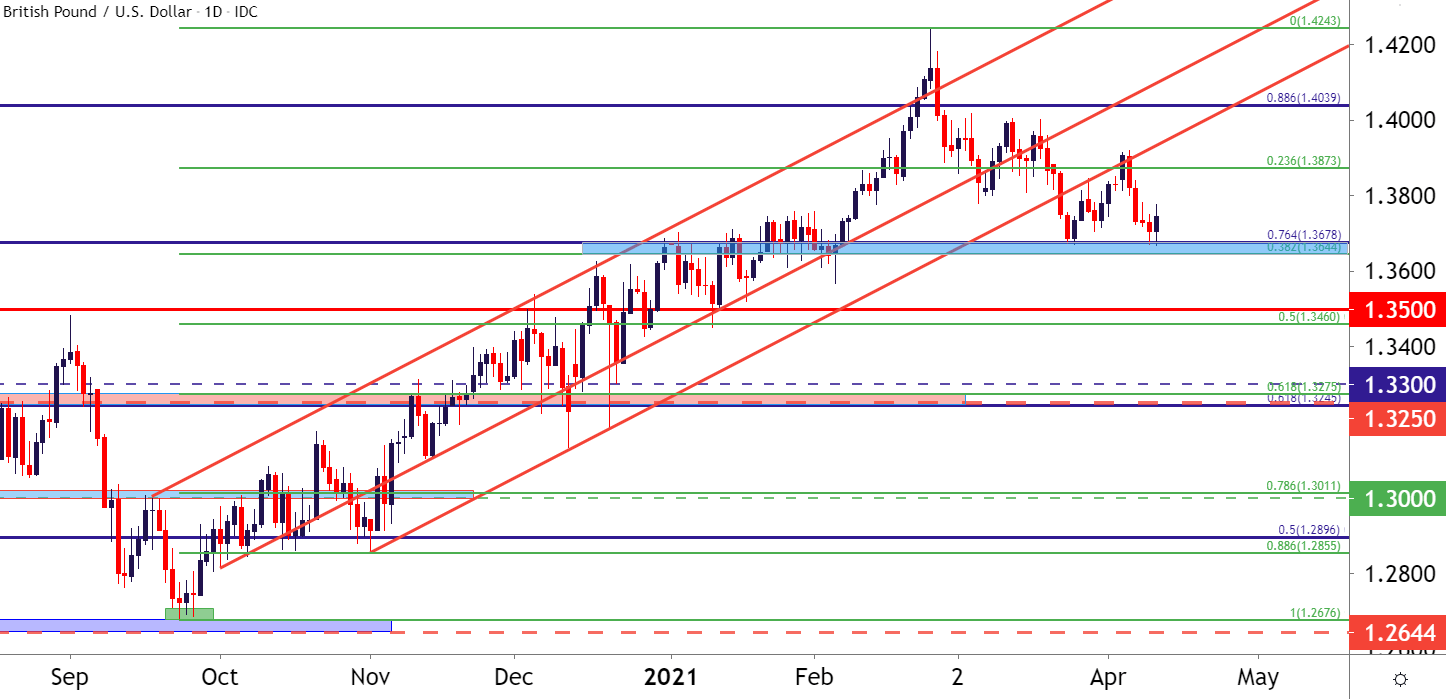
Chart prepared by James Stanley; GBPUSD on Tradingview
GBP/JPY: Wedge Break Goes Ballistic
Last year saw GBP/JPY build in a symmetrical triangle pattern. It was pretty much two different themes as a top was set in December of 2019 that saw the bottom fall out in Q1 of last year. The final three quarters were bulls clawing back those prior losses but, again, much of this took place within the confines of a symmetrical triangle pattern. Such formations will often lead in to breakouts, and that’s precisely what’s happened so far in 2021 trade.
To learn more about the symmetrical triangle pattern, check out DailyFX Education
GBP/JPY Weekly Price Chart
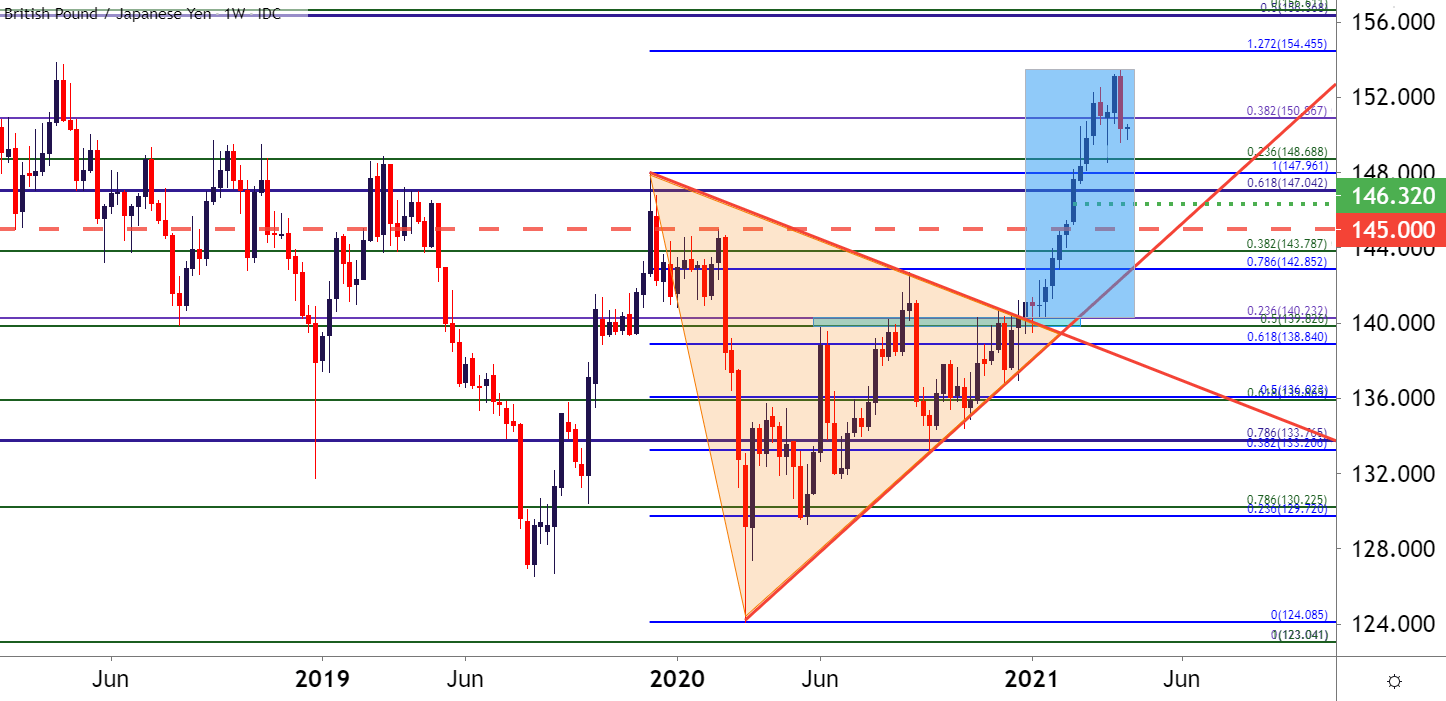
Chart prepared by James Stanley; GBPJPY on Tradingview
The big driver in Q1 of this year was the reflation trade, and this meant big losses for the Japanese Yen. That, combined with GBP strength that was evident in both GBP/USD and EUR/GBP looked at above, and GBP/JPY put in a big move in the first couple months of this year, well over 1,000 pips peak-to-trough.
More recently, however, that topside trend has started to shake, and price action has built-in a channel over the past couple of months with the 150 psychological level playing a key role in the channel’s creation, as the formation began to build as 150 began to show as resistance.
At this point, this puts a ton of emphasis on the 150 psychological level and if buyers can’t hold price action above, attention moves towards deeper supports below the channel around 148.69 and 147.04.
GBP/JPY Eight-Hour Price Chart
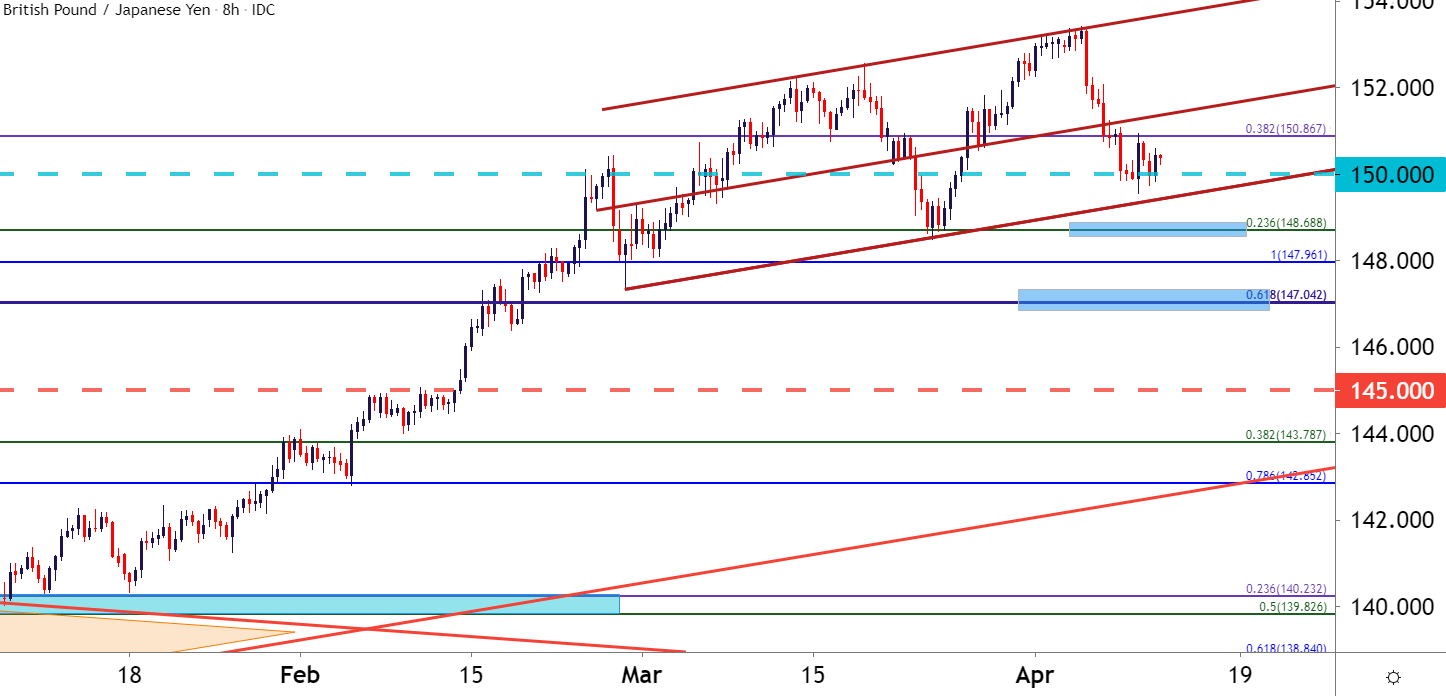
Chart prepared by James Stanley; GBPJPY on Tradingview
--- Written by James Stanley, Strategist for DailyFX.com
Contact and follow James on Twitter: @JStanleyFX


