


USD/JPY Technical Forecast: Neutral
- USD/JPY had a very strong Q1 as the reflation theme drove a bullish trend in the pair.
- The Q2 open so far has shown a different theme: Is this but a pullback in the bullish theme or is that bullish trend on the verge of coming undone?
- The analysis contained in article relies on price action and chart formations. To learn more about price action or chart patterns, check out our DailyFX Education section.
It was a big Q1 for USD/JPY. The normally sleepy pair woke up in a big way as the ‘reflation’ trade drove trends throughout markets. In USD/JPY, where the Bank of Japan has been sitting on negative rates since 2016, that can produce a pretty compelling topside thesis in the pair as higher US rates are meshed with negative/low Japanese rates to produce a fairly compelling case of carry.
This helped USD/JPY to jump by as much as 8.16% from the January low up to the March high, but perhaps even more compelling than that is the resistance that was taken-out along the way. On the below monthly chart I’m looking at a trendline originating in 2015, connecting to the 2020 swing high. That trendline projection caught resistance in early-March and, for about two weeks, held the surging bullish trend at bay. Buyers forced a break later in the month, leading to a fresh yearly high in the pair.
To learn more about trendlines, join us in DailyFX Education
USD/JPY Monthly Price Chart
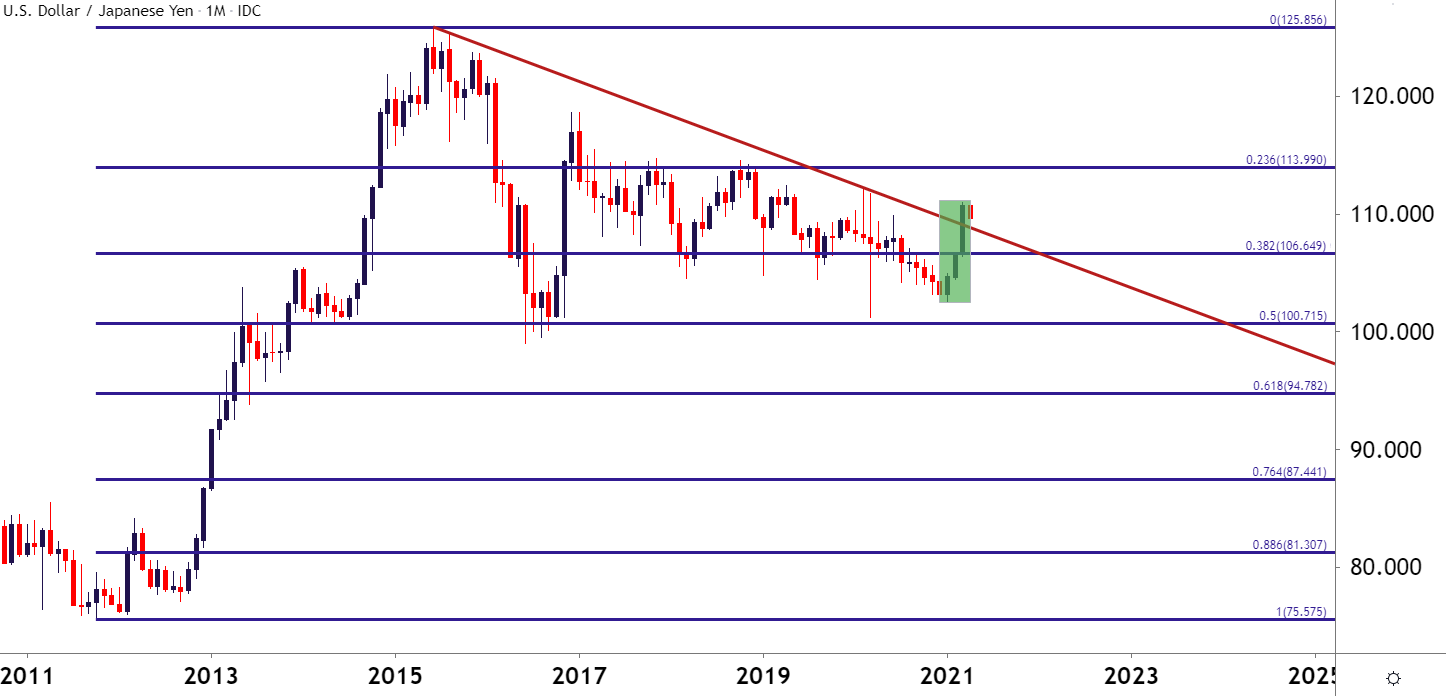
Chart prepared by James Stanley; USD/JPY on Tradingview
Going down to the Daily chart and we can see the impact that this trendline projection had on shorter-term price action. The trendline began to come into play on March 9th, eliciting a minor pullback; and then for a full week starting on March 12th this trendline came in to offer resistance every day. The breakout finally showed up on March 25th and was confirmed on March 26th, with buyers continuing to press up to and beyond the 110.00 psychological level.

USD/JPY Daily Price Chart
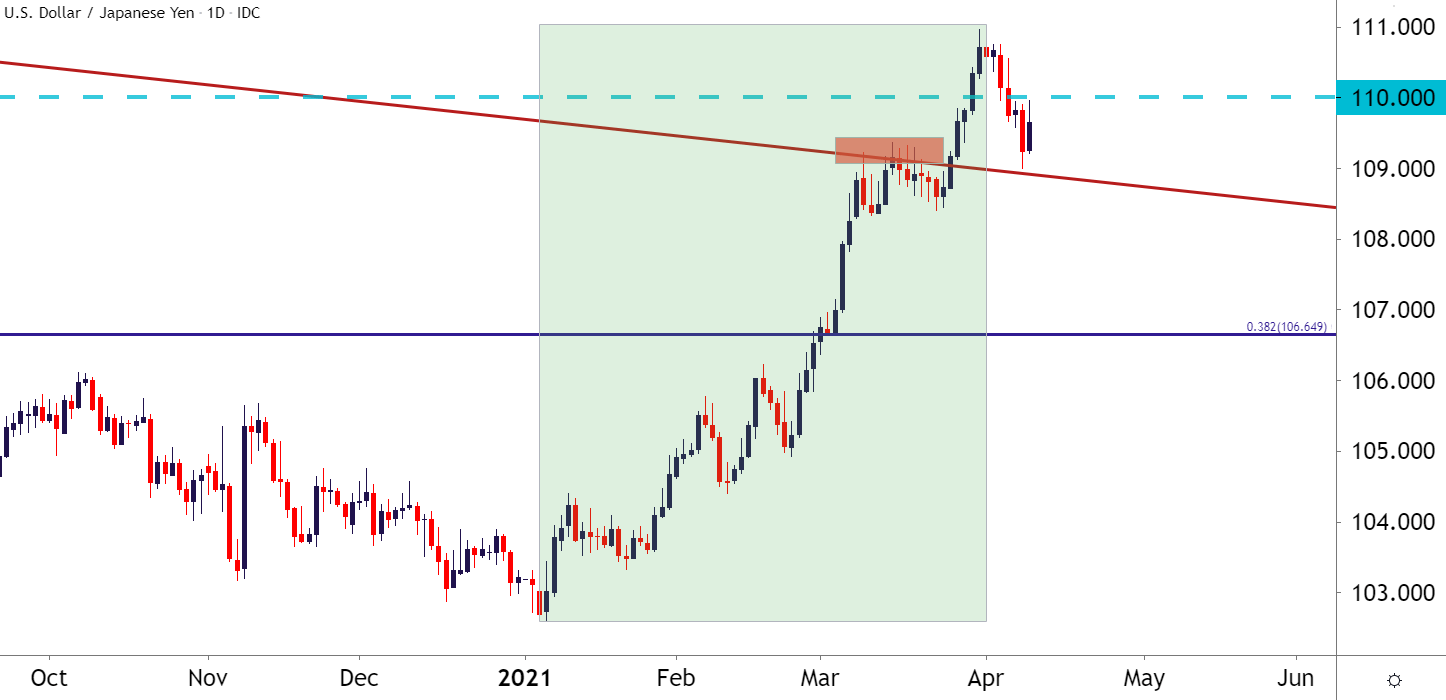
Chart prepared by James Stanley; USD/JPY on Tradingview
USD/JPY Strategy Moving Forward
At this point, shorter-term traders can focus on continuation potential of the recent bullish trend. The Q2 pullback thus far spans a 23.6% retracement of the prior bullish trend – a level that aligns with that batch prior resistance-turned-support.The hurdle for this approach, at least at this point, is the 110.00 psychological level, which bulls will have to re-engage with to continue the trend up to fresh highs.
From a longer-term, bigger-picture point-of-view, however, the possibility of continued reversal remains enticing, especially with the way that the Q1 theme had priced-in, driven by the rates scenario out of the US. This is very evident from the weekly chart, where that big spot of support sticks out which, again, is confluent between a trendline projection and the 23.6% Fibonacci retracement of the recent major move. A breach below this support would also entail a push back-below the trend-line.
This meshes with the RSI composition on the weekly, which this week saw the indicator move back-below 70, indicating a possible bearish signal on that timeframe. Given the duality of the short and long-term looks, the forecast for USD/JPY will be set to neutral for the week ahead.
To learn more about Fibonacci or psychological levels, join us in DailyFX Education
USD/JPY Weekly Price Chart

Chart prepared by James Stanley; USD/JPY on Tradingview
--- Written by James Stanley, Strategist for DailyFX.com
Contact and follow James on Twitter: @JStanleyFX


