


US Dollar Talking Points:
- Tomorrow brings the release of jobs numbers out of the US and Canada, with each report being released at 8:30 AM ET.
- The US Dollar has so far spent early 2020 trade clawing back gains from the December/Q4 sell-off… Can bulls continue to push or will Non-Farm Payrolls bring Dollar bears back into the mix?
US Dollar Primed for NFP
Tomorrow brings the release of Non-Farm Payrolls for the month of December and the expectation is for +160k jobs to have been added to American payrolls in the month of December. As usual, the details inside of the report will be worthy of attention, particularly the Average Hourly Earnings and Unemployment rate.
The US Dollar has thus far started 2020 with a course reversal from the Q4 sell-off. While USD finished last year clinging to five-month-lows, a retracement has developed that’s seen a portion of the December loss clawed back. On Tuesday, I had looked at bullish potential around the US Dollar, brought upon by a longer-term area of support that had led to the build of a shorter-term bullish price action formation. The ascending triangle on the hourly and four-hour charts led to a topside breakout, and USD price action is now rushing towards another area of resistance on DXY that shows around the 97.70 level. That 97.70 level held the highs in November and December of 2018 as well as March of 2019; and more recently this same price helped to mark the mid-December swing highs before sellers were able to push down to fresh lows.
US Dollar Daily Price Chart
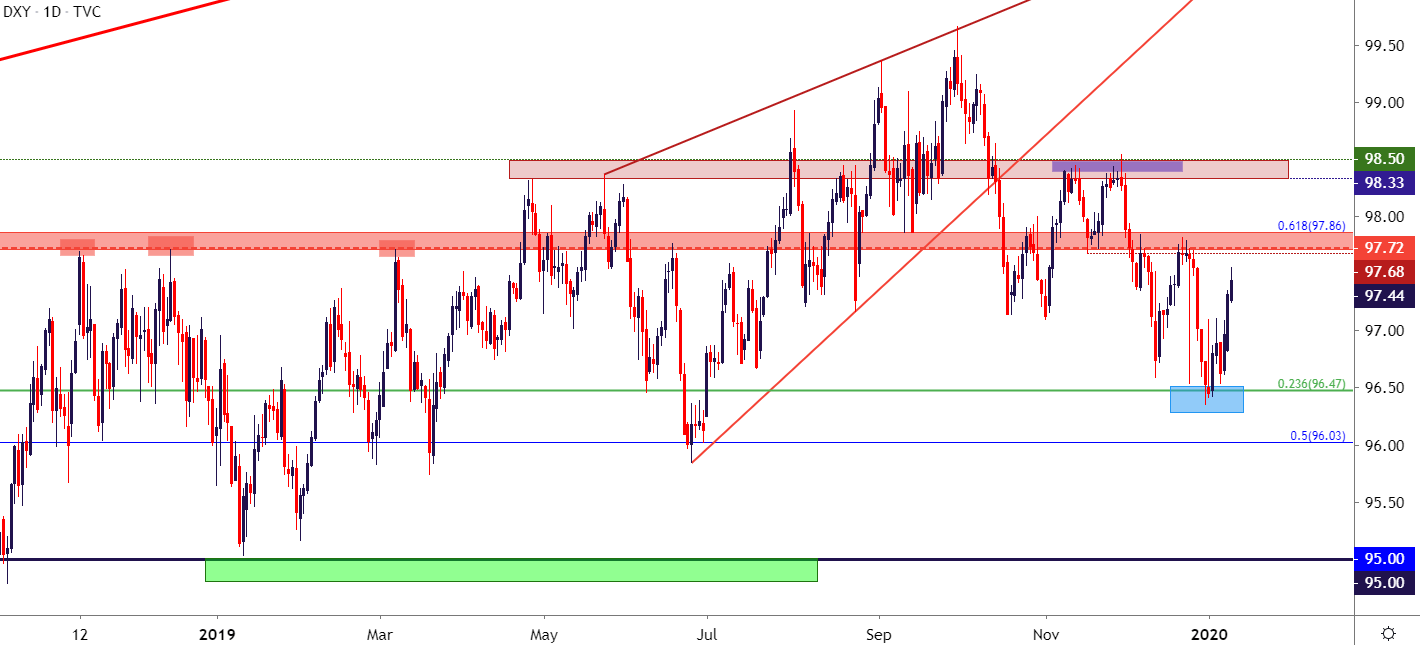
Chart prepared by James Stanley; US Dollar on Tradingview
EUR/USD Resistance Reaction
Earlier this week EUR/USD tested a key zone of resistance that runs from 1.1187-1.1212. That area helped to hold the highs and sellers took another swing in the early portion of this week. Prices in the pair are now nearing prior swing support around the 1.1082 level, which could complicate short-term bearish strategies. This does, however, keep the door open for lower-high resistance around the 1.1145 price or, alternatively, support plays off of a re-test of 1.1082 coupled with a hold of higher-low support.
EUR/USD Four-Hour Price Chart

Chart prepared by James Stanley; EURUSD on Tradingview
GBP/USD: Bounce from Support, Longer-Term Bull Pennant Remains
Some positive news showed up on the Brexit front this morning and it now looks fairly certain that the UK will leave the EU at the end of this month. In the British Pound, the currency was previously on its back foot this morning as driven by some commentary out of the Bank of England. Prices moved down to a key support zone for a test at which point buyers responded. This support shows around the October swing-high of 1.3013.
GBP/USD Two-Hour Price Chart
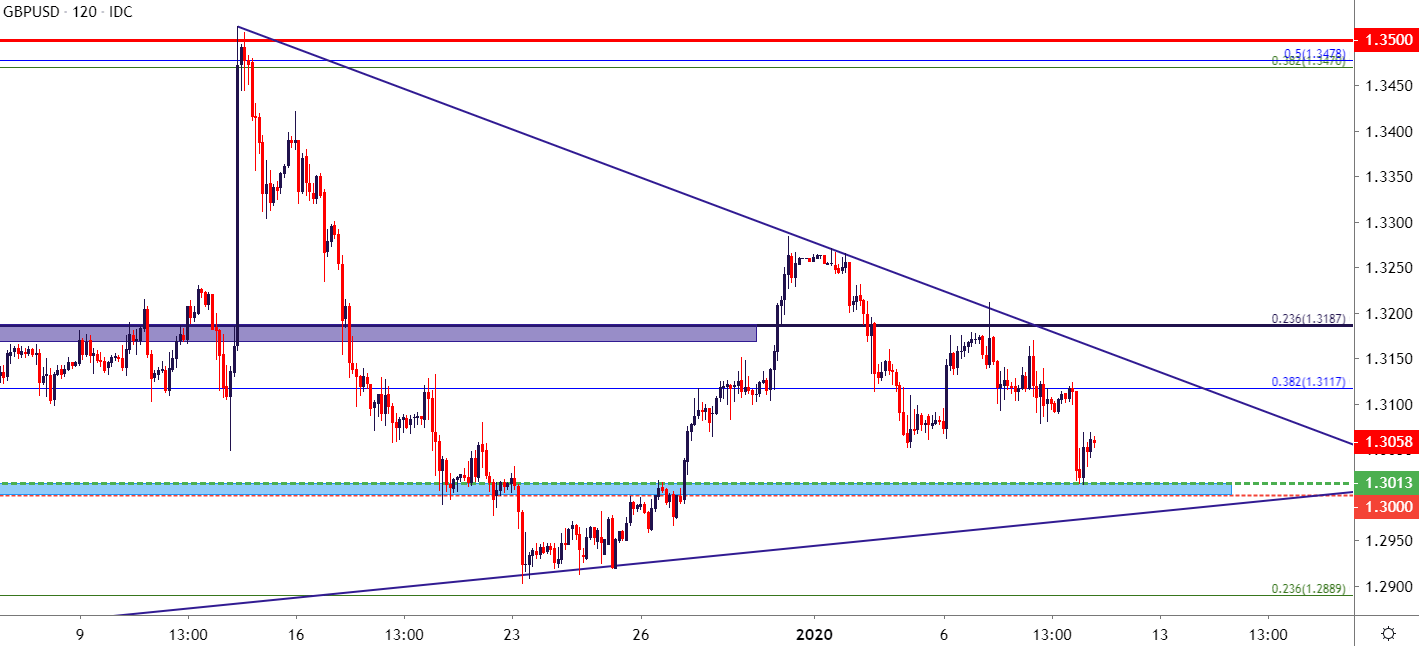
Chart prepared by James Stanley; GBPUSD on Tradingview
On a longer-term basis, the pair remains confined to a recent pattern of congestion following the December bullish breakout. This could make longer-term positioning or strategy as more of a challenge, at least until price action breaks out from the symmetrical wedge that’s been building over the past month.
GBP/USD Daily Price Chart

Chart prepared by James Stanley; GBPUSD on Tradingview
USD/CAD: In Focus Ahead of Jobs Reports
Also at 8:30 AM ET tomorrow will be the release of Canadian jobs numbers. This could amount to a fairly volatile backdrop in USD/CAD as both currencies in the pair are seeing headline-driven volatility.
USD/CAD came into 2020 after setting a fresh yearly low, testing below the vaulted psychological level at 1.3000. But, as looked at during Tuesday’s webinar, sellers showed little reaction with prices below that prior support level and, since then, price action has snapped back to retrace a portion of that prior sell-off.
At this point, prices in USD/CAD are holding at a confluent resistance level taken from around 1.3100. This comes from the mid-December swing low coupled with the underside of a longer-term trendline projection. A bit-higher is another area of resistance interest, taken from around the 1.3132 level.
USD/CAD Daily Price Chart

Chart prepared by James Stanley; USDCAD on Tradingview
USD/JPY Nearing Key Resistance Around Seven-Month-Highs
USD/JPY came into the year driven by fear, quickly falling down to fresh three month lows. But as calm has retuned, so have USD/JPY bulls, and price action in the pair is now approaching a key zone of resistance that proved very tough to break in the latter-portion of 2019. This shows around 109.66, and can be extended up to the 110.00 level to create a zone of potential resistance.
USD/JPY Daily Price Chart
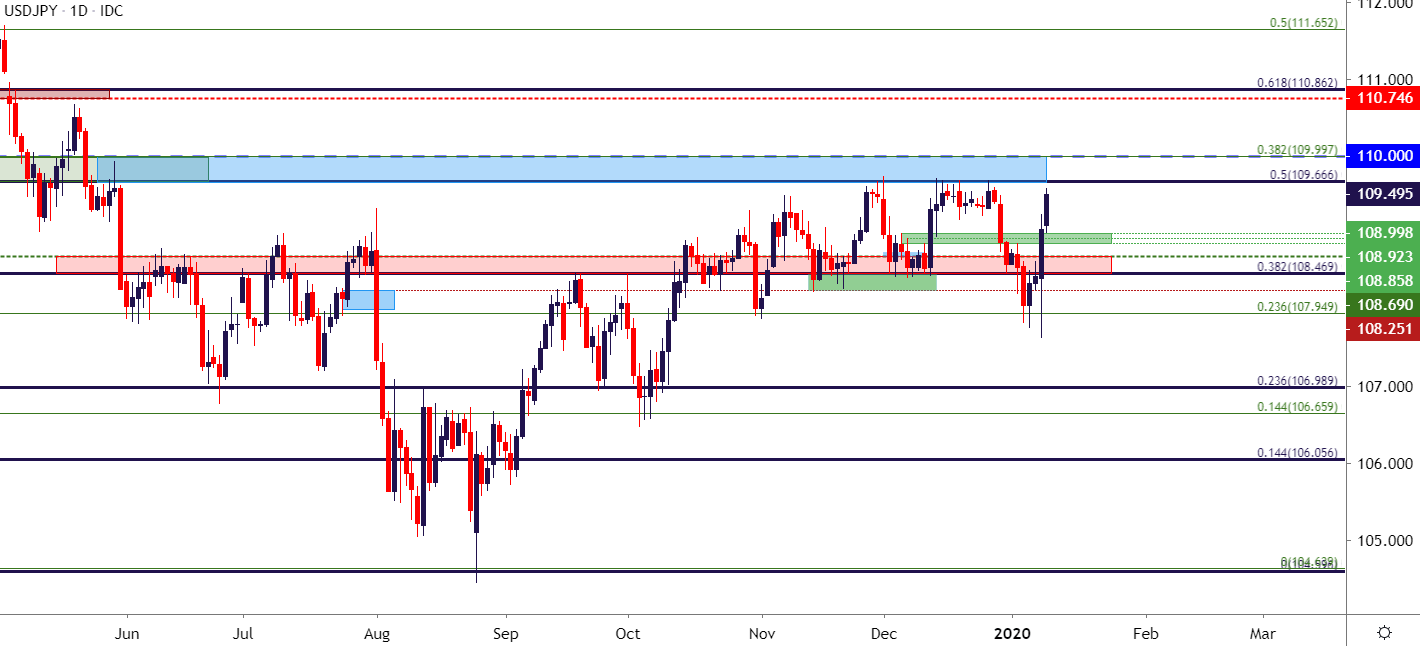
Chart prepared by James Stanley; USDJPY on Tradingview
--- Written by James Stanley, Strategist for DailyFX.com
Contact and follow James on Twitter: @JStanleyFX


