


US Dollar Price Action Talking Points:
- The US Dollar put in a bearish reaction to a key comment from yesterday’s press conference following the FOMC’s rate cut.
- Focus now shifts to US data as market participants are attempting to read the tea leaves in the effort of forecasting the Fed’s next move.
- DailyFX Forecasts are published on a variety of markets such as Gold, the US Dollar or the Euro and are available from the DailyFX Trading Guides page. If you’re looking to improve your trading approach, check out Traits of Successful Traders. And if you’re looking for an introductory primer to the Forex market, check out our New to FX Guide.
The US Dollar has put in a strong push of weakness over the past 24 hours on the heels of yesterday’s FOMC rate decision. While the initial rate statement and the first part of the press conference appeared to bring into play USD-strength, with DXY flickering up to a key area of resistance that runs from 97.86-97.94. But there was a comment from FOMC Chair Powell that appeared to bring bears into the mix when he said that the bank wasn’t looking to raise rates unless there was a ‘really significant’ increase in inflation. This, at the least, allayed some of the fears around the Fed getting back into a hiking cycle, similar to what was alluded to at the July rate cut when the bank posed the move as a ‘mid cycle adjustment.’
So the focus now moves towards US data and tomorrow brings a big data point with the release of October Non-Farm Payrolls out of the US. In this webinar, I looked at setups on either side of the Greenback, focusing-in on USD-weakness scenarios in EUR/USD, GBP/USD and USD/CAD while focusing on USD-strength in areas such as AUD/USD and NZD/USD.
US Dollar Eight-Hour Price Chart: Resistance Reaction Pushes Down to October Lows
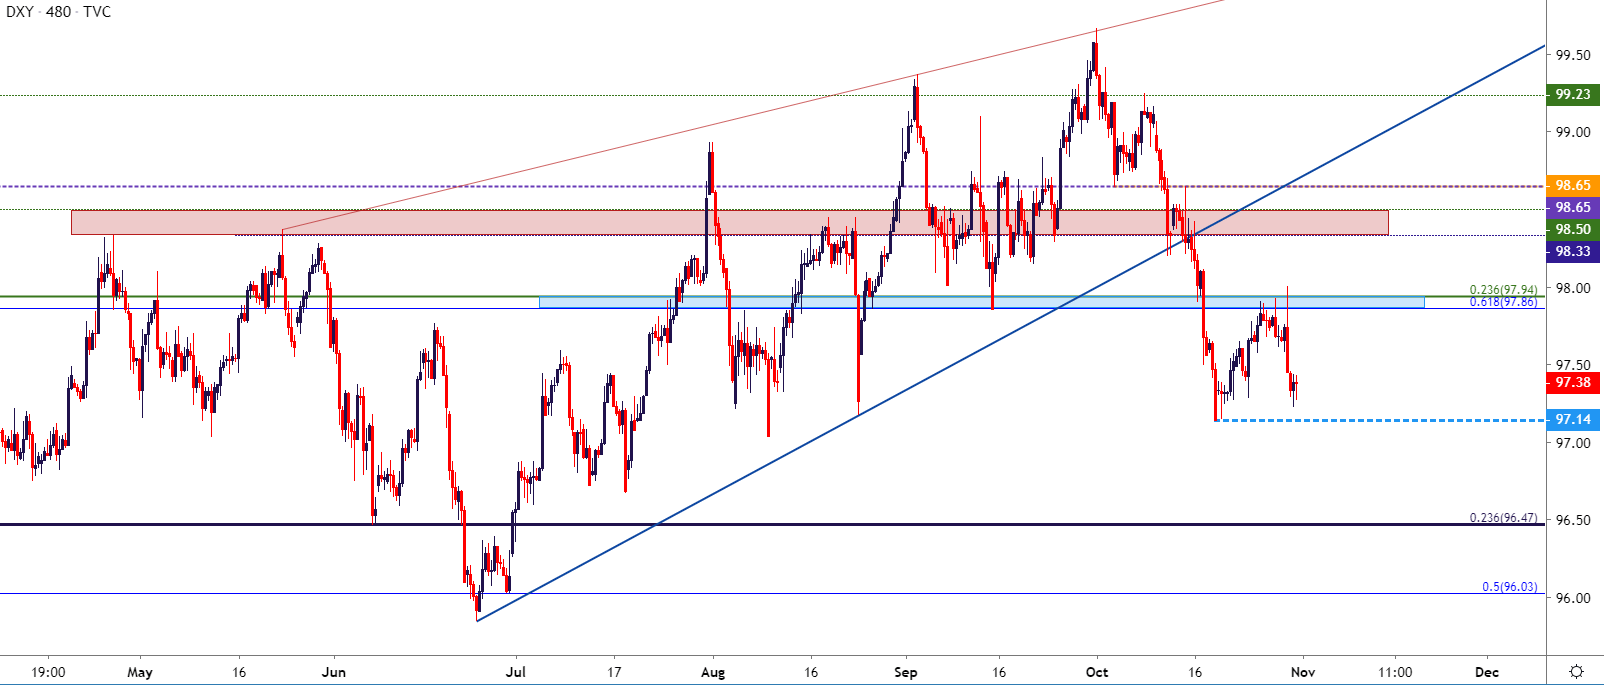
Chart prepared by James Stanley; US Dollar on Tradingview
EUR/USD Finds Support at Trendline Projection
A big resistance zone lurks above on EUR/USD that runs from 1.1187-1.1212. That area of prices has yet to come into play and yesterday saw another instance of buyers shying away from a re-test of this key zone.
EUR/USD Four-Hour Price Chart
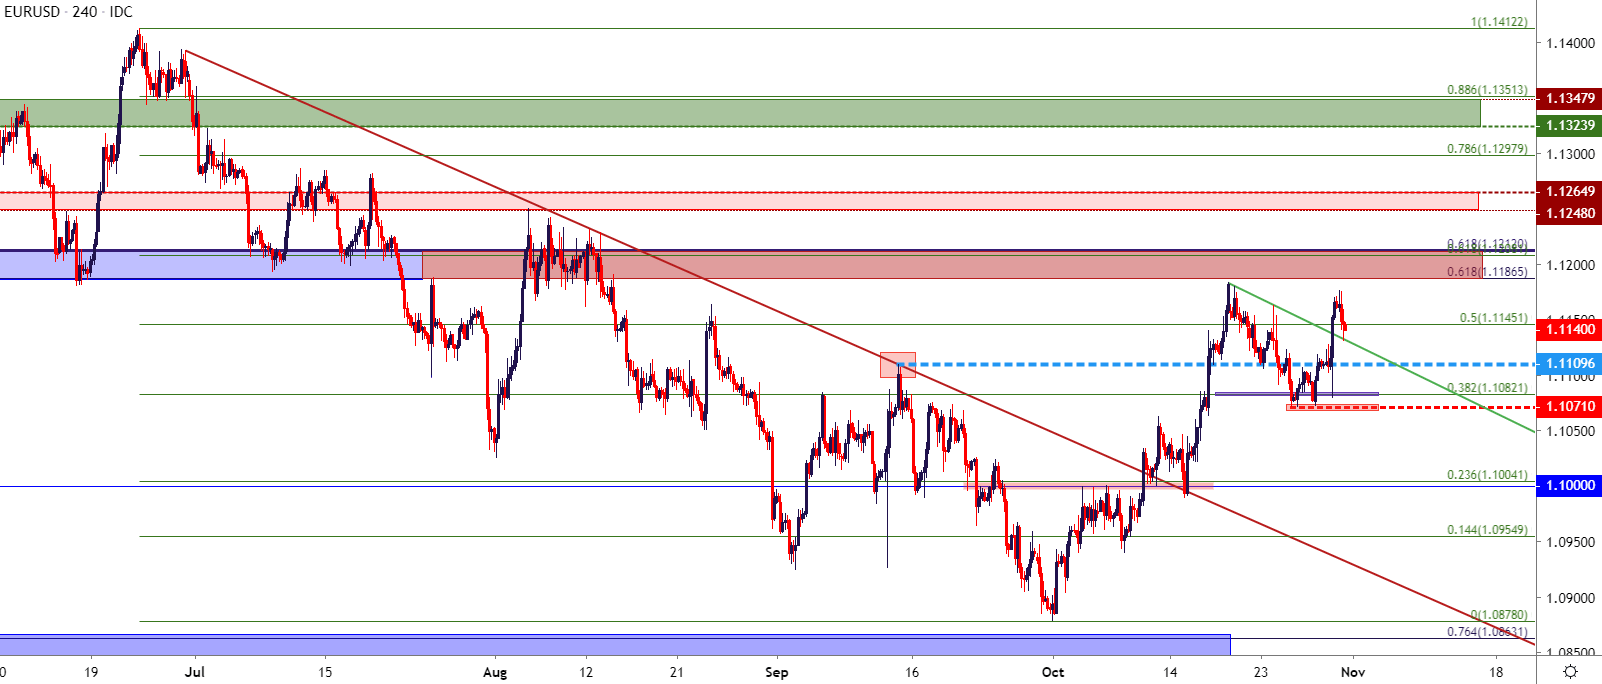
Chart prepared by James Stanley; EURUSD on Tradingview
GBP/USD Pushes Back Towards 1.3000
GBP/USD tip-toed outside of the bull flag formation earlier this week, and the potential for strength in the pair remains, particularly if USD-weakness sticks around. This can keep the door open for support potential around the 1.2900 level, after which targets can be cast towards 1.2950 and 1.3000 for bullish continuation scenarios.
GBP/USD Two-Hour Price Chart
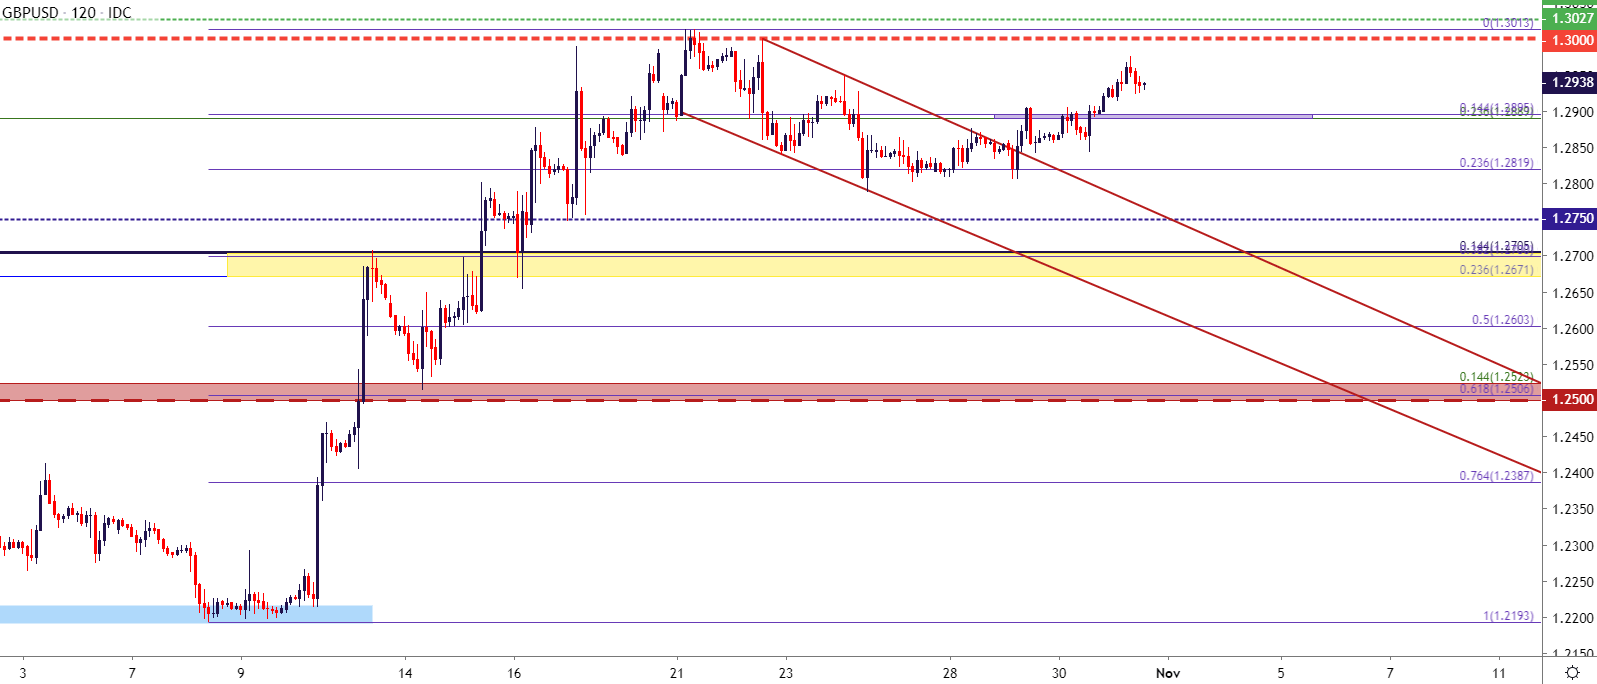
Chart prepared by James Stanley; GBPUSD on Tradingview
USD/CAD Finds Resistance at 1.3200 After BoC/FOMC
Yesterday also brought a Bank of Canada rate decision into the mix with the BoC taking on a more-dovish tone. This drove CAD-weakness into the FOMC rate decision and that initial USD-strength helped to bring into play a big area of resistance in USD/CAD at the 1.3200 handle. That level has since helped to hold the highs with price action reverting to support at the prior resistance zone, running from 1.3132-1.3150. This can keep the door open for bearish scenarios in the pair, looking for a hold of resistance around 1.3200 to allow for bearish continuation strategies.
USD/CAD Four-Hour Price Chart
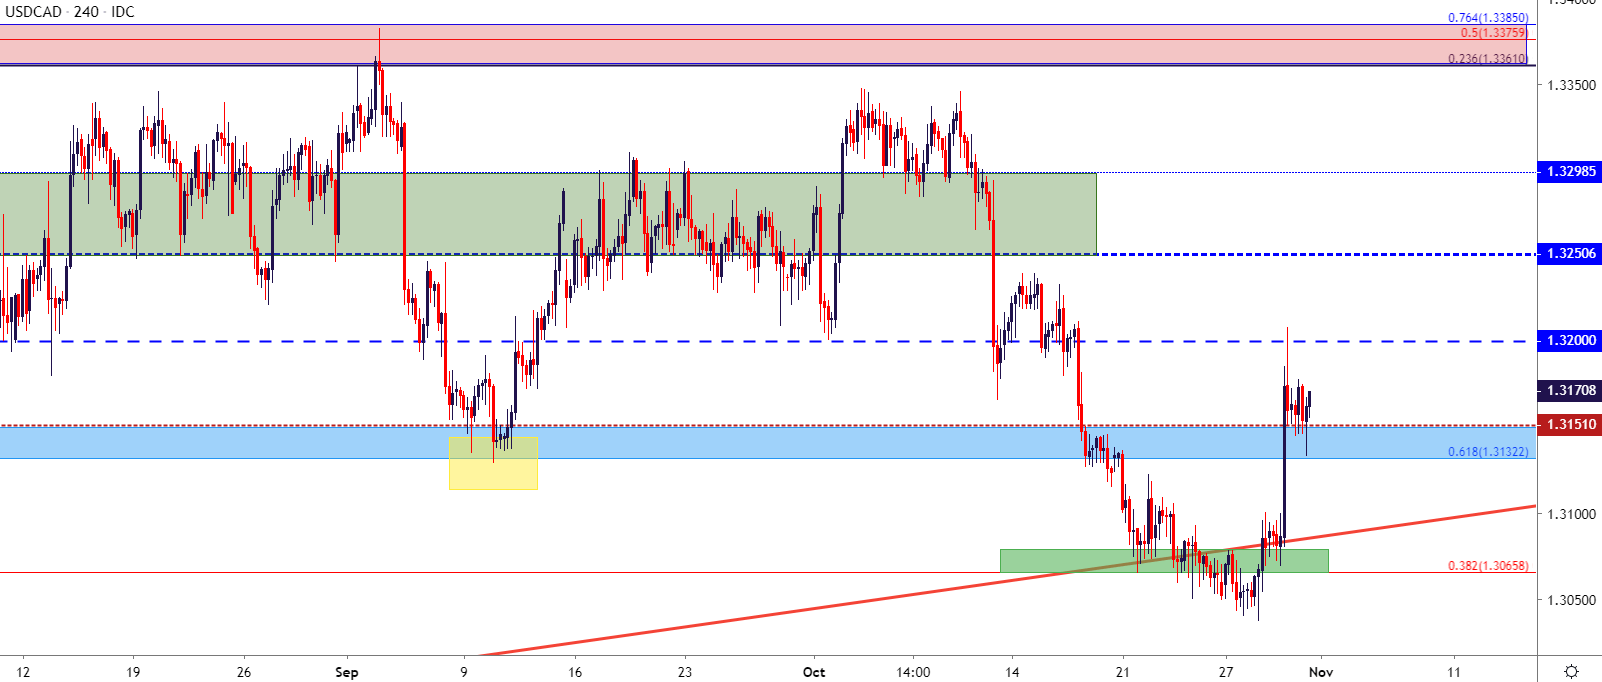
Chart prepared by James Stanley; USDCAD on Tradingview
USD/JPY Smashed, Bullish Strategies No Longer Attractive
I had previously looked at bullish scenarios in USD/JPY for long-USD scenarios. But given yesterday’s reaction, that scenario no longer looks as attractive and, if anything, the door may soon be opening for short-side swing scenarios in the pair, looking for resistance in that key zone that runs from 108.47-108.70.
USD/JPY Four-Hour Price Chart
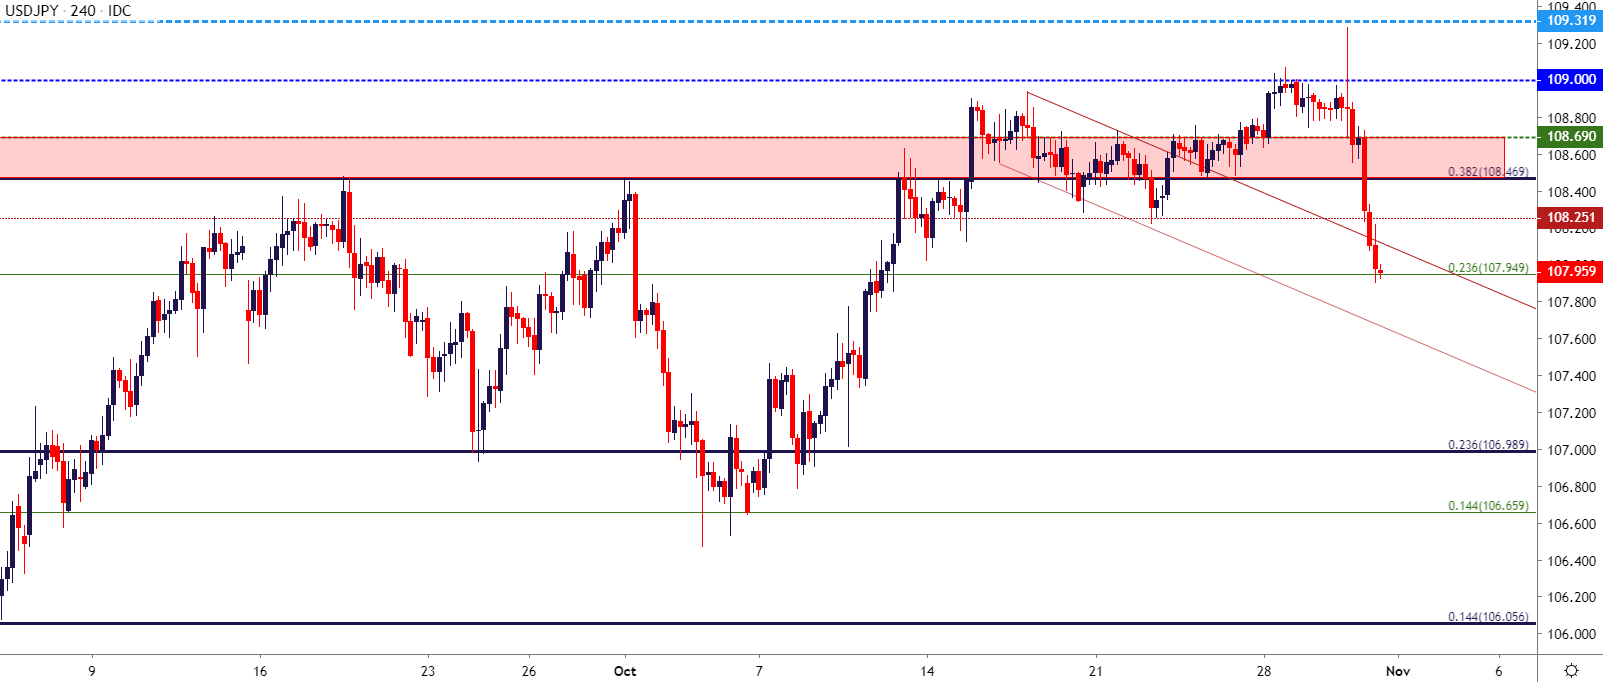
Chart prepared by James Stanley; USDJPY on Tradingview
AUD/USD for Long-USD Scenarios
One pair that does remain attractive for a USD-bounce of bullish scenario is AUD/USD. The pair broke out to fresh two-month-highs on the back of yesterday’s US Dollar weakness. But resistance soon showed up from a bearish trendline projection as taken from swing-highs produced in November of last year connected with the April swing-high. This same trendline helped to hold resistance in July and so far sellers are showing an attractive reaction there.
AUD/USD Daily Price Chart
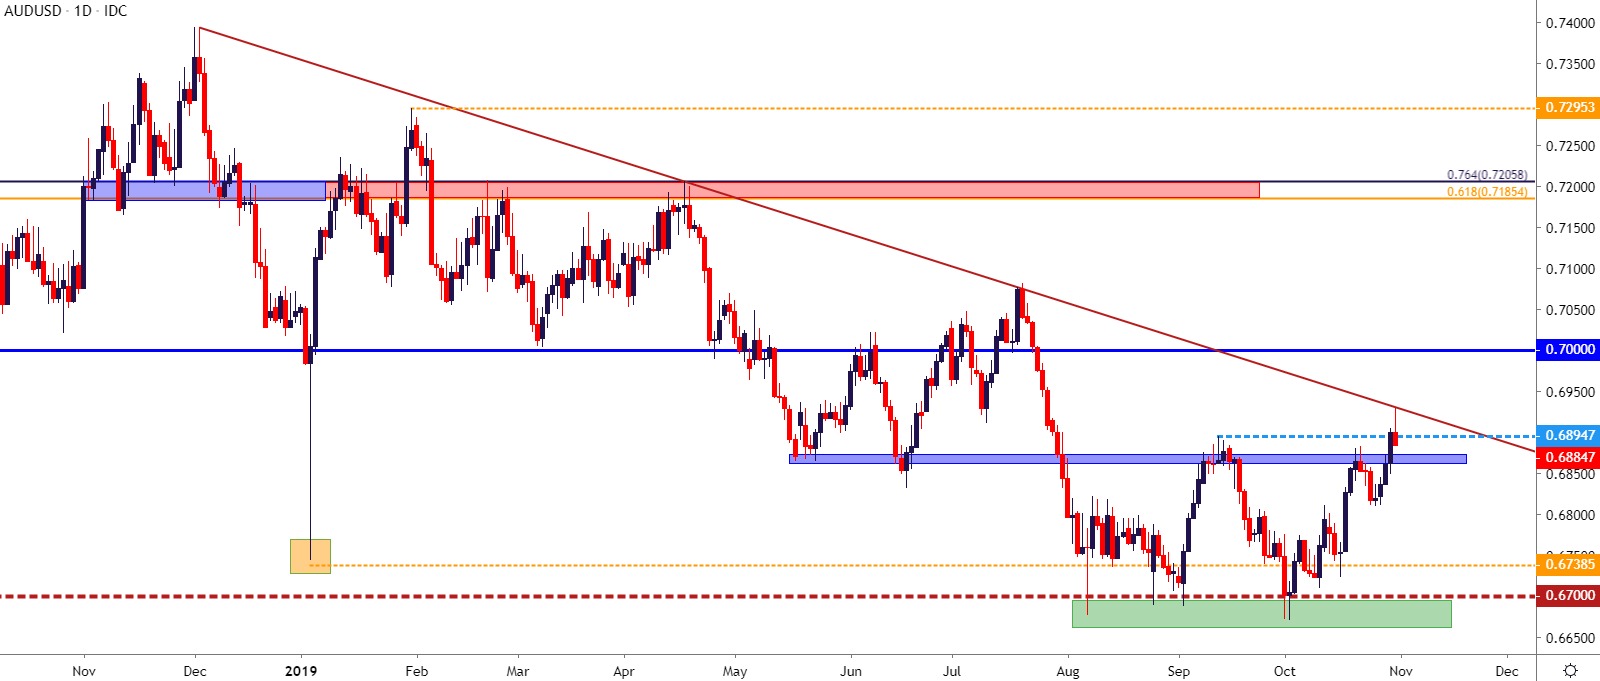
Chart prepared by James Stanley; AUDUSD on Tradingview
To read more:
Are you looking for longer-term analysis on the U.S. Dollar? Our DailyFX Forecasts have a section for each major currency, and we also offer a plethora of resources on Gold or USD-pairs such as EUR/USD, GBP/USD, USD/JPY, AUD/USD. Traders can also stay up with near-term positioning via our IG Client Sentiment Indicator.
Forex Trading Resources
DailyFX offers an abundance of tools, indicators and resources to help traders. For those looking for trading ideas, our IG Client Sentiment shows the positioning of retail traders with actual live trades and positions. Our trading guides bring our DailyFX Quarterly Forecasts and our Top Trading Opportunities; and our real-time news feed has intra-day interactions from the DailyFX team. And if you’re looking for real-time analysis, our DailyFX Webinars offer numerous sessions each week in which you can see how and why we’re looking at what we’re looking at.
If you’re looking for educational information, our New to FX guide is there to help new(er) traders while our Traits of Successful Traders research is built to help sharpen the skill set by focusing on risk and trade management.
--- Written by James Stanley, Strategist for DailyFX.com
Contact and follow James on Twitter: @JStanleyFX


