


Gold has been trading within the confines of a clean upward channel, traders operating from both sides can use it to help guide their actions. Crude oil has been a grind and with it sitting near the top of a rising channel it may be nearing a point of weakness. The Dow is trading below an important resistance zone, in the days ahead it could build a breakout pattern (up or down?). The DAX is in a precarious position, watch for the current bounce to fizzle into selling in the days ahead…
Technical Highlights:
- Gold’s upward channel remains the focus
- Crude oil trading up into top of channel, may come off
- Dow Jones congestion under resistance
- DAX strength seen as countertrend move only
Make more informed decisions by checking out our trading forecasts and educational resources on the DailyFX Trading Guides page.
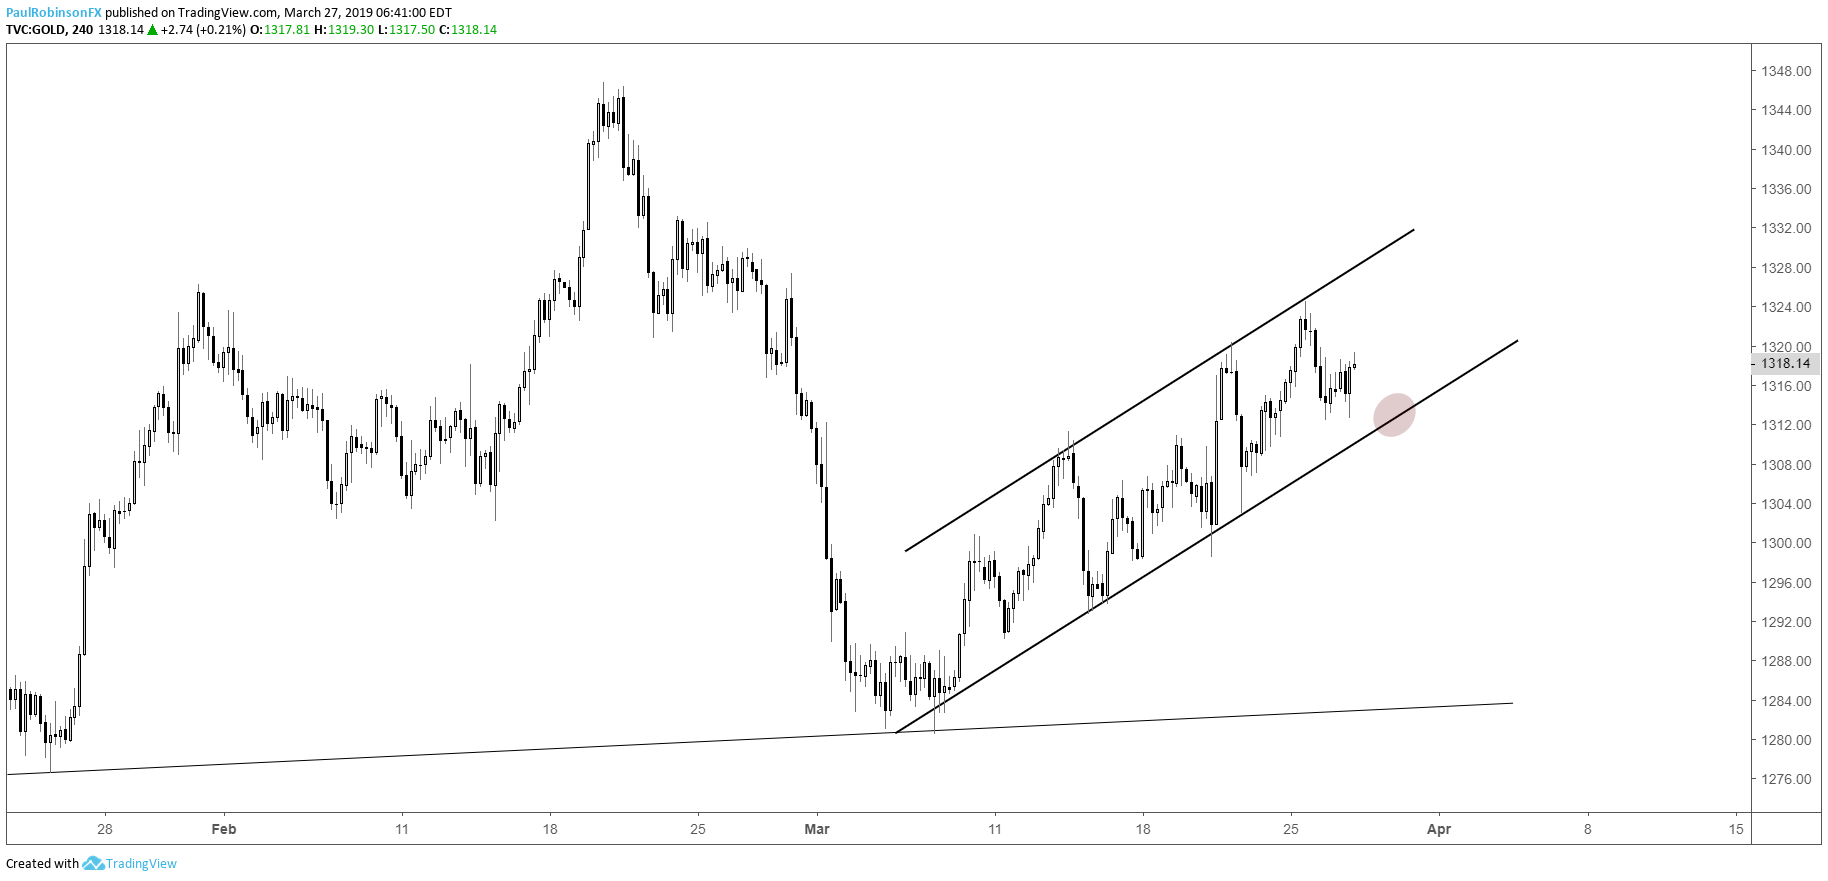
Gold’s upward channel remains the focus
The upward channel continues to be the primary focus on this end and as long gold stays within its confines the outlook is neutral at worst, bullish at best. While overall price action after the decline off the February high smacks of corrective given the overlapping nature of it, it will require a break of the lower parallel to turn aggressively bearish.
Gold 4-hr Chart (channel guide)
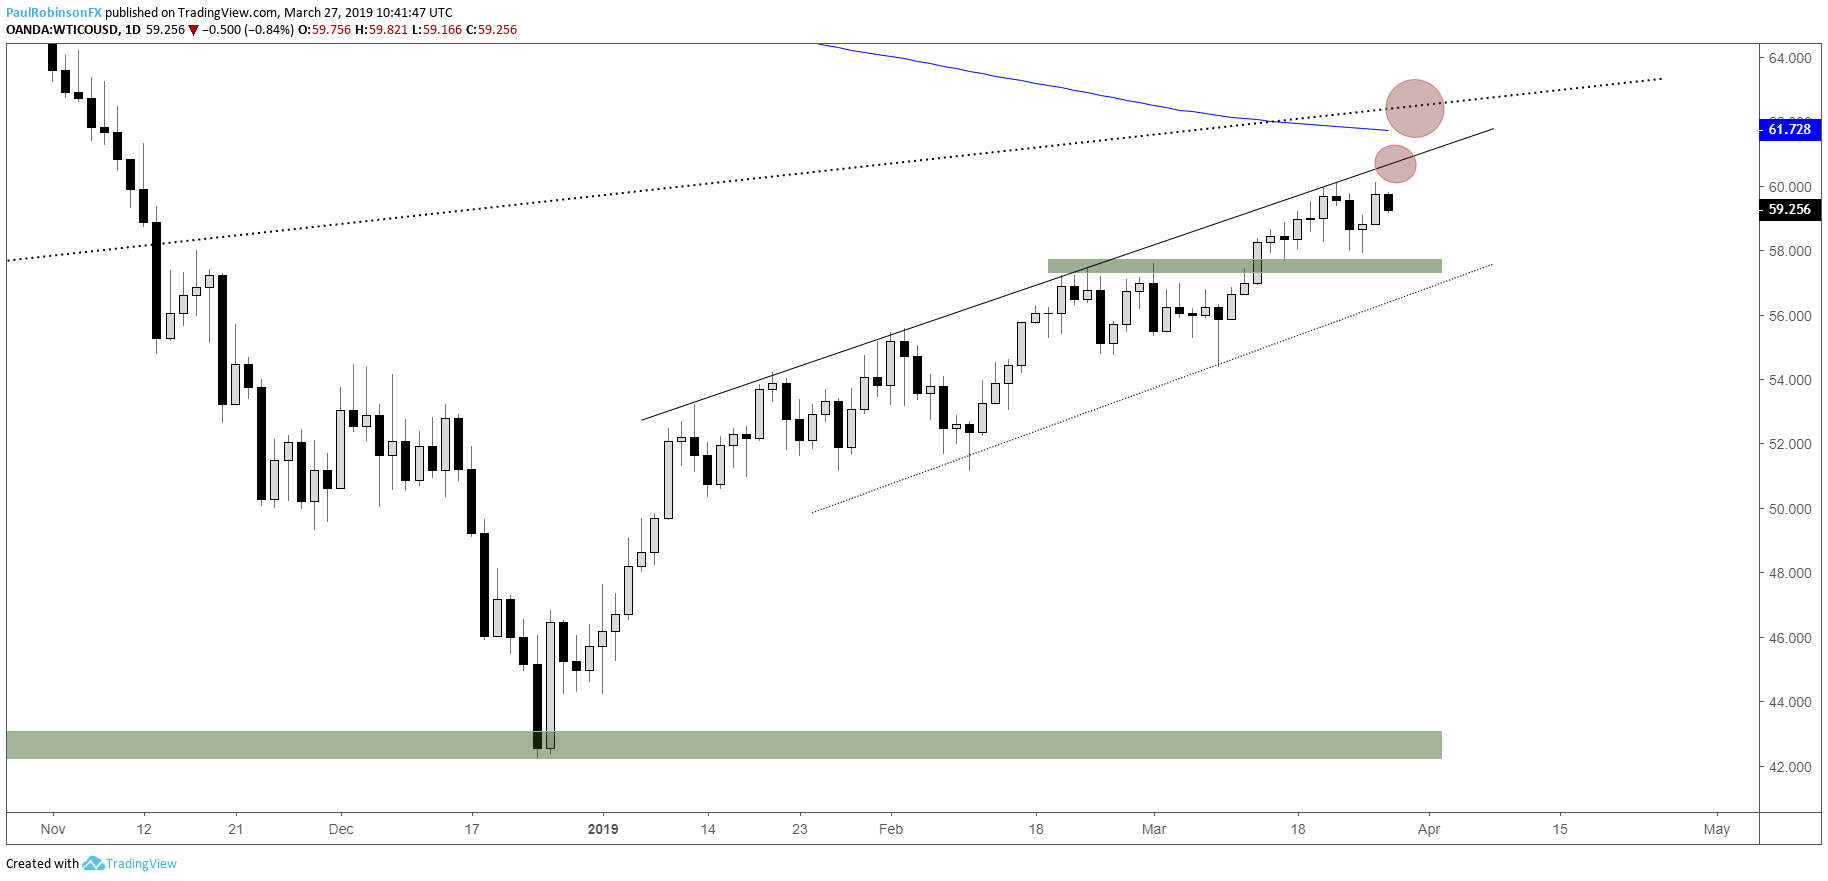
Crude oil trading up into top of channel, may come off
Oil continues to maintain a bid and in grinding fashion it is working its way higher within the confines of an upward sloping channel. There may be a minor set-back soon, though, with the upper slope of the formation having acted as resistance on several prior occasions, as recent as last week. Weakness may be short-lived as the trend continues to be higher for now. The underside of the 2016 trend-line and 200-day combo will be viewed as a possible topper for oil.
Crude oil Daily Chart (higher into channel resistance)
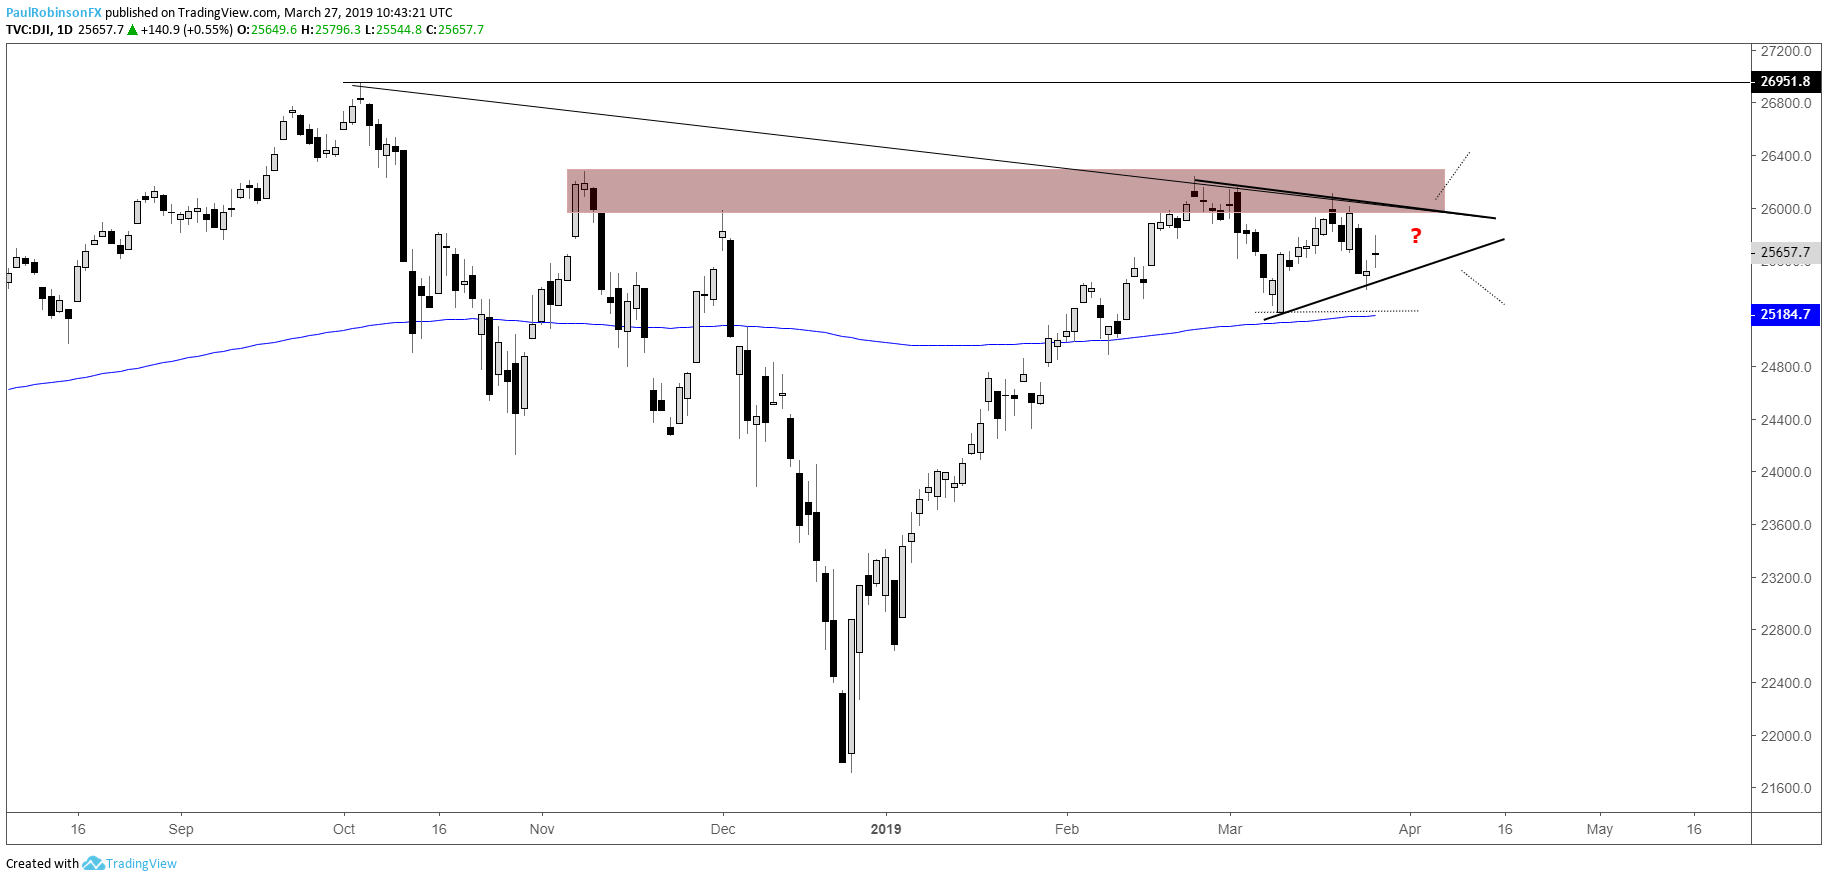
Dow Jones congestion under resistance
The Dow is bouncing around and with a little more time it could leave us with a breakout pattern. A triangle under resistance around the 26k-mark will put the market in a position where an explosive move could develop. For now, though, risk/reward is lacking from either side of the tape…
Dow Jones Daily Chart (triangle to form?)
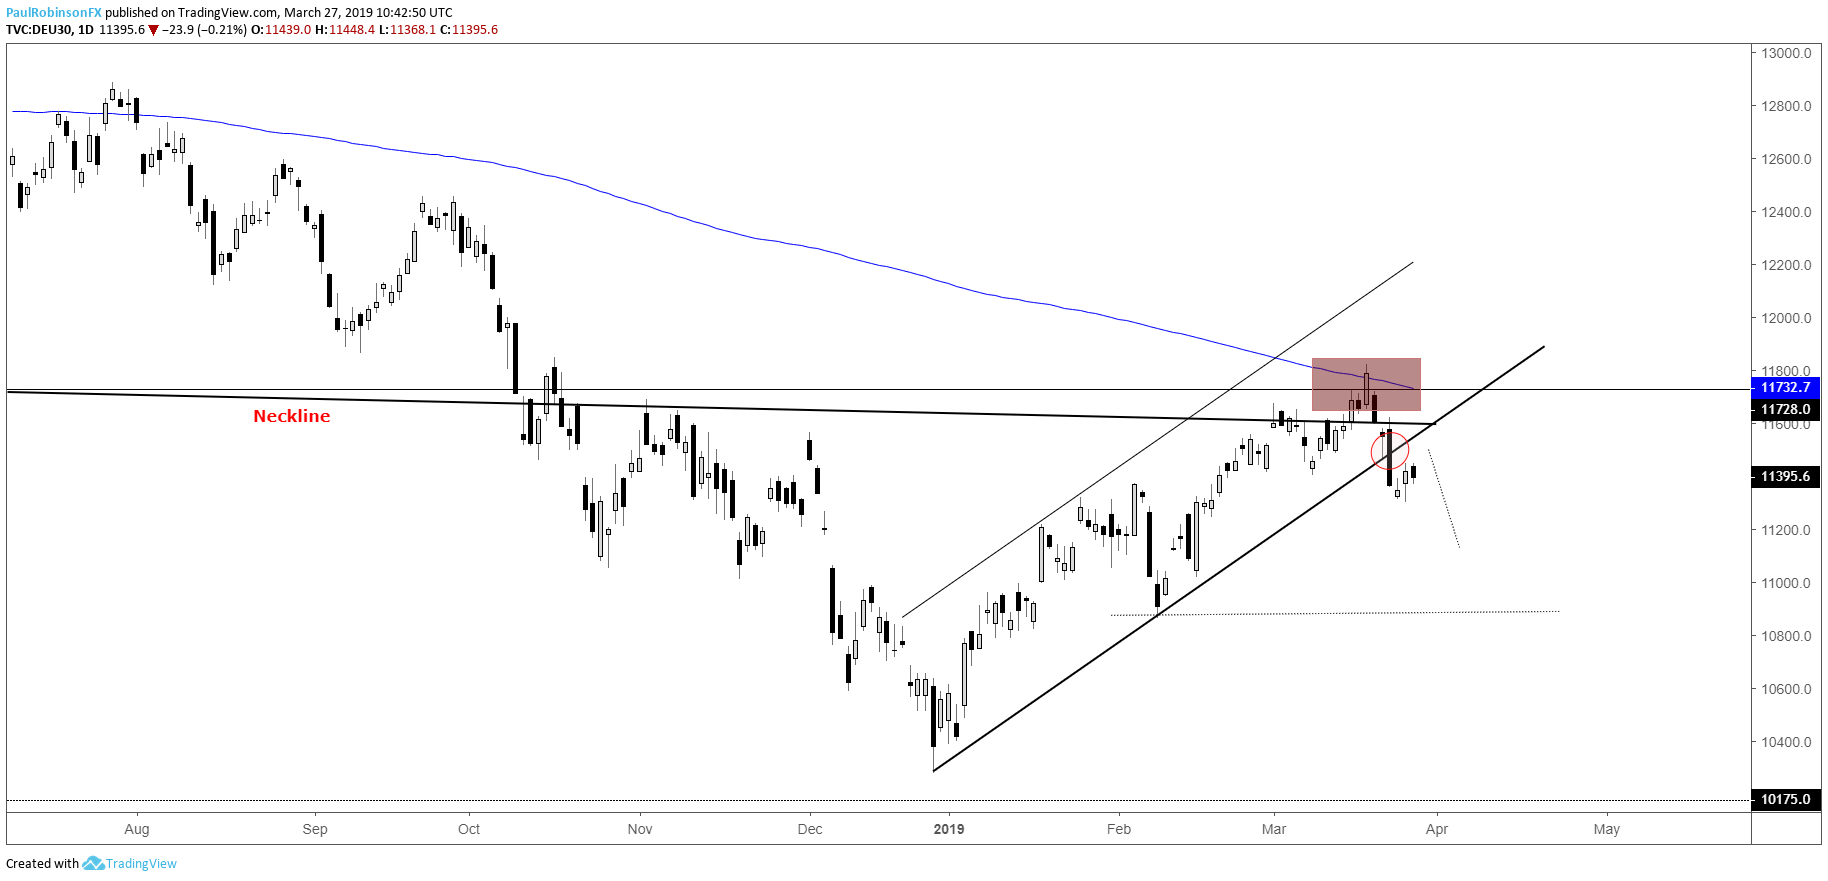
DAX 30 strength seen as countertrend move only
The DAX backed off rather aggressively from confluent resistance, most importantly the neckline of the long-term head-and-shoulders top. Weakness also pushed the German benchmark below the rising trend-line off the December low. The current bounce could put in the right shoulder of a short-term head-and-shoulders pattern and result in another down-move. In any event, the rejection from long-term resistance and breaking of intermediate-term trend support has the DAX set up for lower prices.
DAX Daily Chart (rally set to fizzle soon)
Resources for Index & Commodity Traders
Whether you are a new or an experienced trader, DailyFX has several resources available to help you; indicator for tracking trader sentiment, quarterly trading forecasts, analytical and educational webinars held daily, and trading guides to help you improve trading performance.
We also have a series of guides for those looking to trade specific markets, such as the S&P 500, Dow, DAX, gold, silver, crude oil, and copper.
---Written by Paul Robinson, Market Analyst
You can follow Paul on Twitter at @PaulRobinsonFX


