


Global stock market volatility has been high as of late and likely to stay elevated for the foreseeable future. The S&P 500 and Dow are near or at big support tests, but with the leading Nasdaq 100 already having made a lower low in this down cycle it doesn’t appear the October lows will hold for long. The DAX is trading around the important 2011 trend-line, the last line of major support. The collapse in crude oil has been fierce and while overdue for a bounce it’s lacking any real bullish price action to lean on. Gold remains a difficult market to get a handle on as it trades between support and resistance.
Technical Highlights:
- S&P 500 & Dow at or near important support tests
- DAX 30 trading around key trend-line from 2011
- Crude oil oversold but lacking support levels to lean on
- Gold price caught between support and resistance
See how the majority of traders are positioned in various markets/currencies and what it says about future price fluctuations – IG Client Sentiment
S&P 500 & Dow at or near important support tests
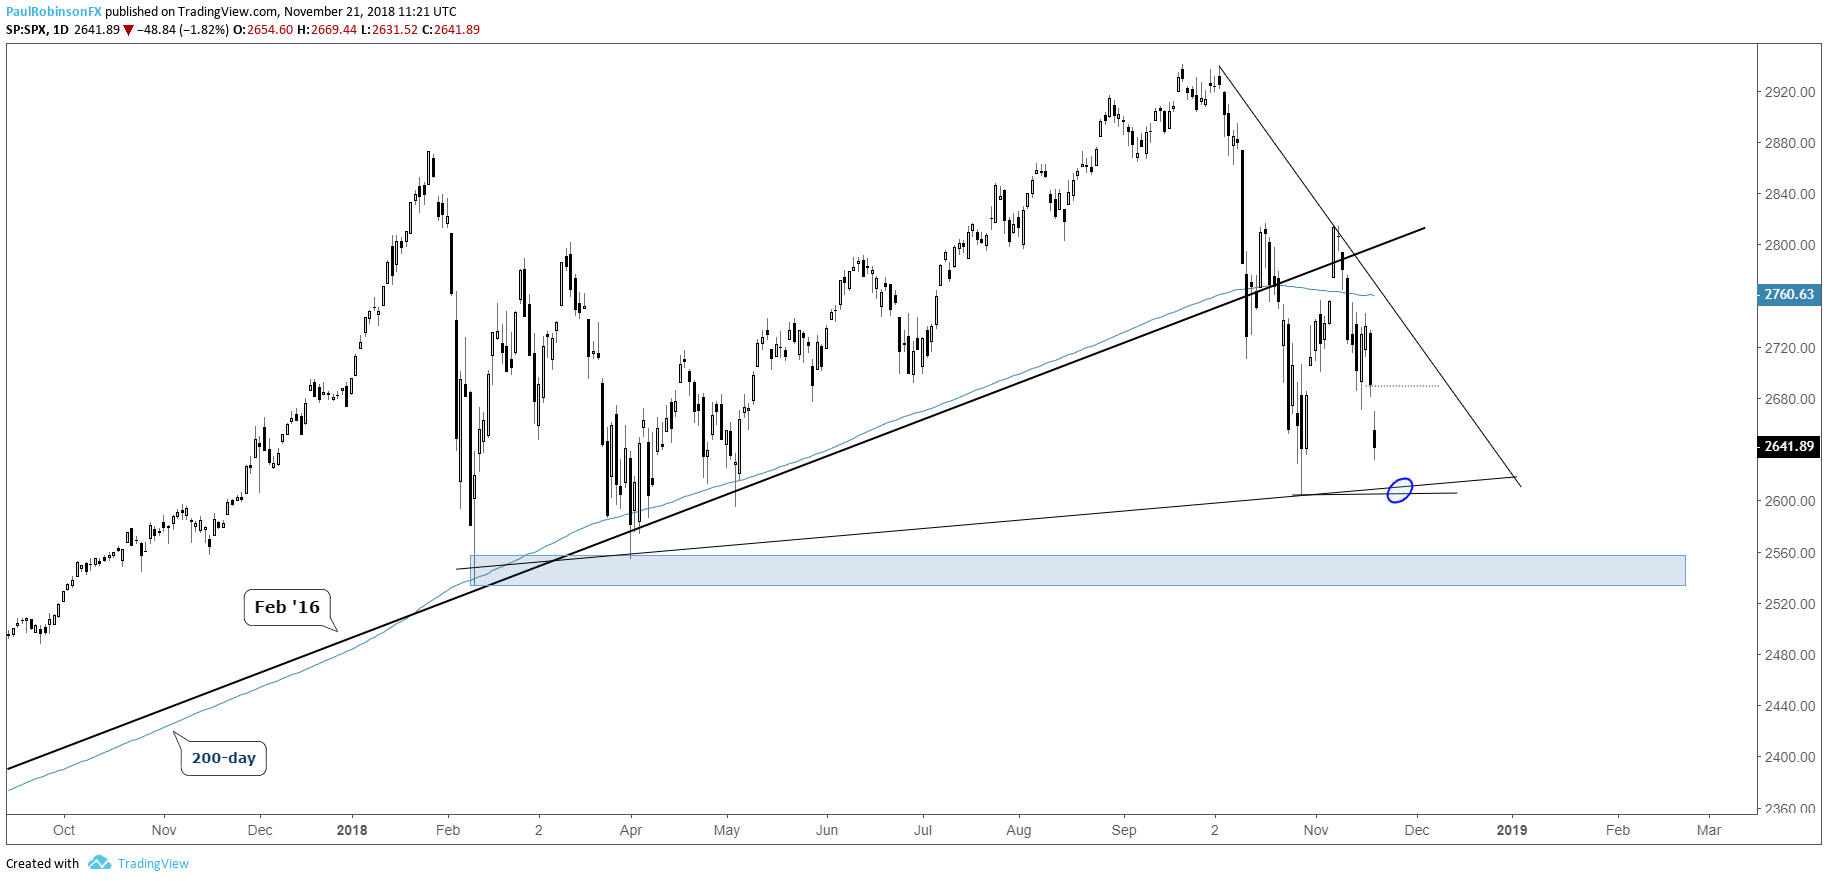
The S&P 500 is nearing the October low at 2603, which also runs in the vicinity of a trend-line from earlier this year. A bounce may develop here soon, possibly filling yesterday’s gap, but overall the best approach at this time is to sell once rallies start to fade. The leading Nasdaq 100 has already made a lower-low from last month, hinting at both the S&P and Dow doing the same at some point soon.
S&P 500 Daily Chart (Watch support)
For our intermediate-term fundamental and technical take, see the Q4 Global Equities Forecast
The Dow is trading at the critical February 2016 trend-line, and in near conjunction is a trend-line from February of this year. Whether a bounce or not develops from here the anticipation is for a new low soon. The lows from Feb-May will be targeted on further weakness.
Dow Daily Chart (several points of support)

DAX 30 trading around key trend-line from 2011
The DAX is sitting precariously around the 2011 trend-line. With the head-and-shoulders dating back to June having already been triggered, this is viewed as the last line of support before a much broader move lower develops. Like the U.S. indices, we may see a bounce develop here but don’t look for it to be lasting.
DAX Daily Chart (Precariously close to leaving 2011 t-line behind)

Crude oil oversold but lacking support levels to lean on
The decline in crude oil prices has been surprisingly fierce, and while I’ve talked about the potential for a big down-move off the 2008 trend-line, expectations were not for it to happen all at once. Looking to catch a bounce looks dangerous but so does shorting with price so oversold. For now staying away. But if there is one take-way worth mentioning, is that with oil dropping as hard as it has in tandem with stock market volatility rising sharply, things are beginning to turn macro and this should be a good thing for traders focused on all asset classes as we head towards a new year.
Crude oil Daily Chart (oversold but not good support)

For our intermediate-term fundamental and technical take, see the Q4 Crude Oil Forecast
Gold price caught between support and resistance
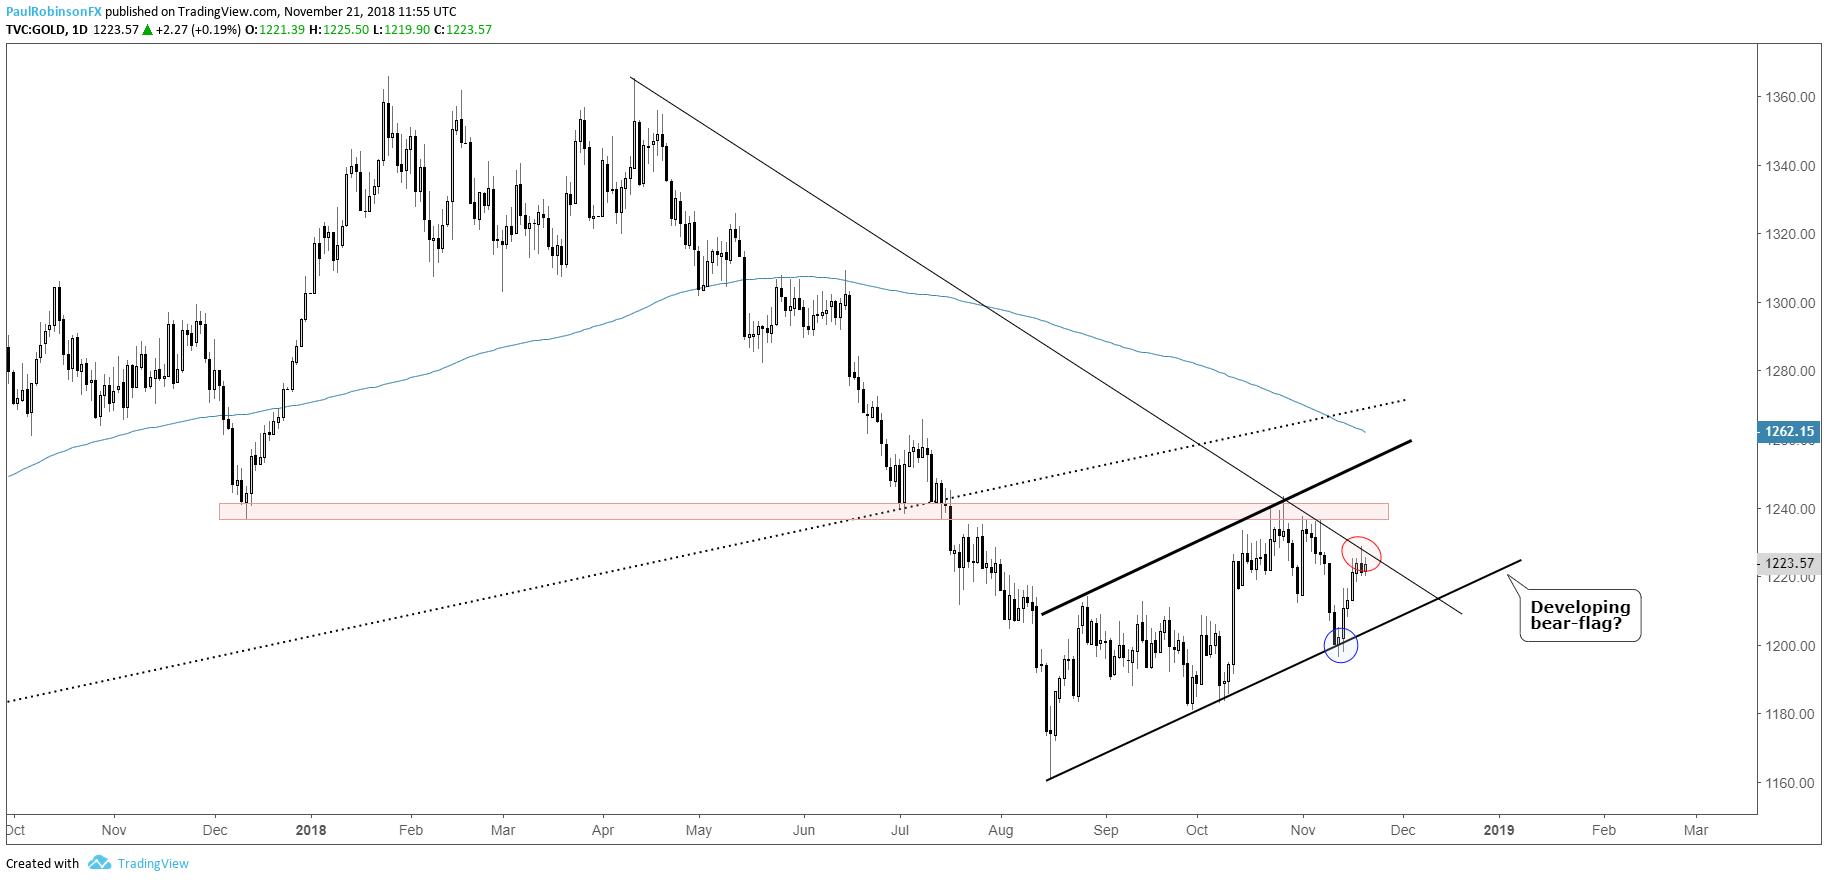
Gold remains a spot of low volatility and limited opportunity, and while this is set to change, until it does we have to operate with what we have. The small turn off trend-line resistance yesterday could bring a bit of weakness, but support quickly arrives at the lower parallel of what is starting to look like a maturing bear-flag since the August low.
For our intermediate-term fundamental and technical take, see the Q4 Gold Forecast
Gold Daily Chart (at t-line, bear-flag forming)
Resources for Index & Commodity Traders
Whether you are a new or an experienced trader, DailyFX has several resources available to help you; indicator for tracking trader sentiment, quarterly trading forecasts, analytical and educational webinars held daily, and trading guides to help you improve trading performance.
We also have a series of guides for those looking to trade specific markets, such as the S&P 500, Dow, DAX, gold, silver, crude oil, and copper.
---Written by Paul Robinson, Market Analyst
You can follow Paul on Twitter at @PaulRobinsonFX


