


At the immediate moment, things are a bit indecisive with the dollar, but there are some technical developments to keep an eye on in DXY. The euro is the driver here, 11500 is a big downside level for the single-currency while there lies resistance not far ahead to be overcome. GBP/CAD is sparking intrigue on a couple of time-frames. The DAX continues to be a big concern for global stock markets, running lower towards a big support test. Gold is trying to make good on another higher-low, but still at risk of falling apart again.
Technical Highlights:
- DXY and euro have techs to watch
- GBP/CAD sparking intrigue on two time-frames
- DAX trading towards important neckline test
- Gold price in limbo; higher low or rolling over?
To check out our intermediate-term fundamental and technical outlook on major markets and currencies, see the DailyFX Trading Forecasts.
DXY and euro have techs to watch
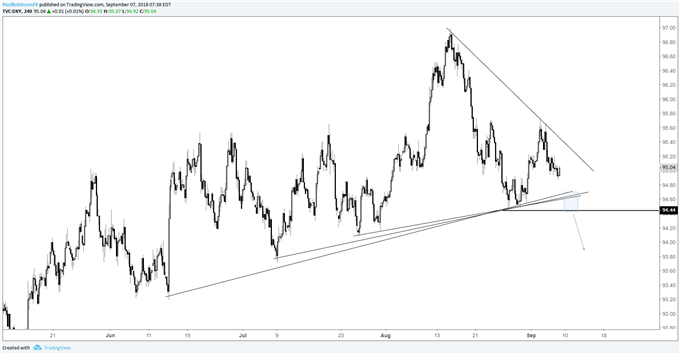
The US Dollar Index (DXY) turned lower from resistance earlier this week and with it has the prospect of a lower-high forming from last month’s peak. There are several trend-lines of varying angles down towards 9460 which make up a cluster of support, if broken along with a lower-low beneath 9443, look for the dollar to start rolling downhill.
US Dollar Index (DXY) 4-hr Chart (Support just below holds the key)
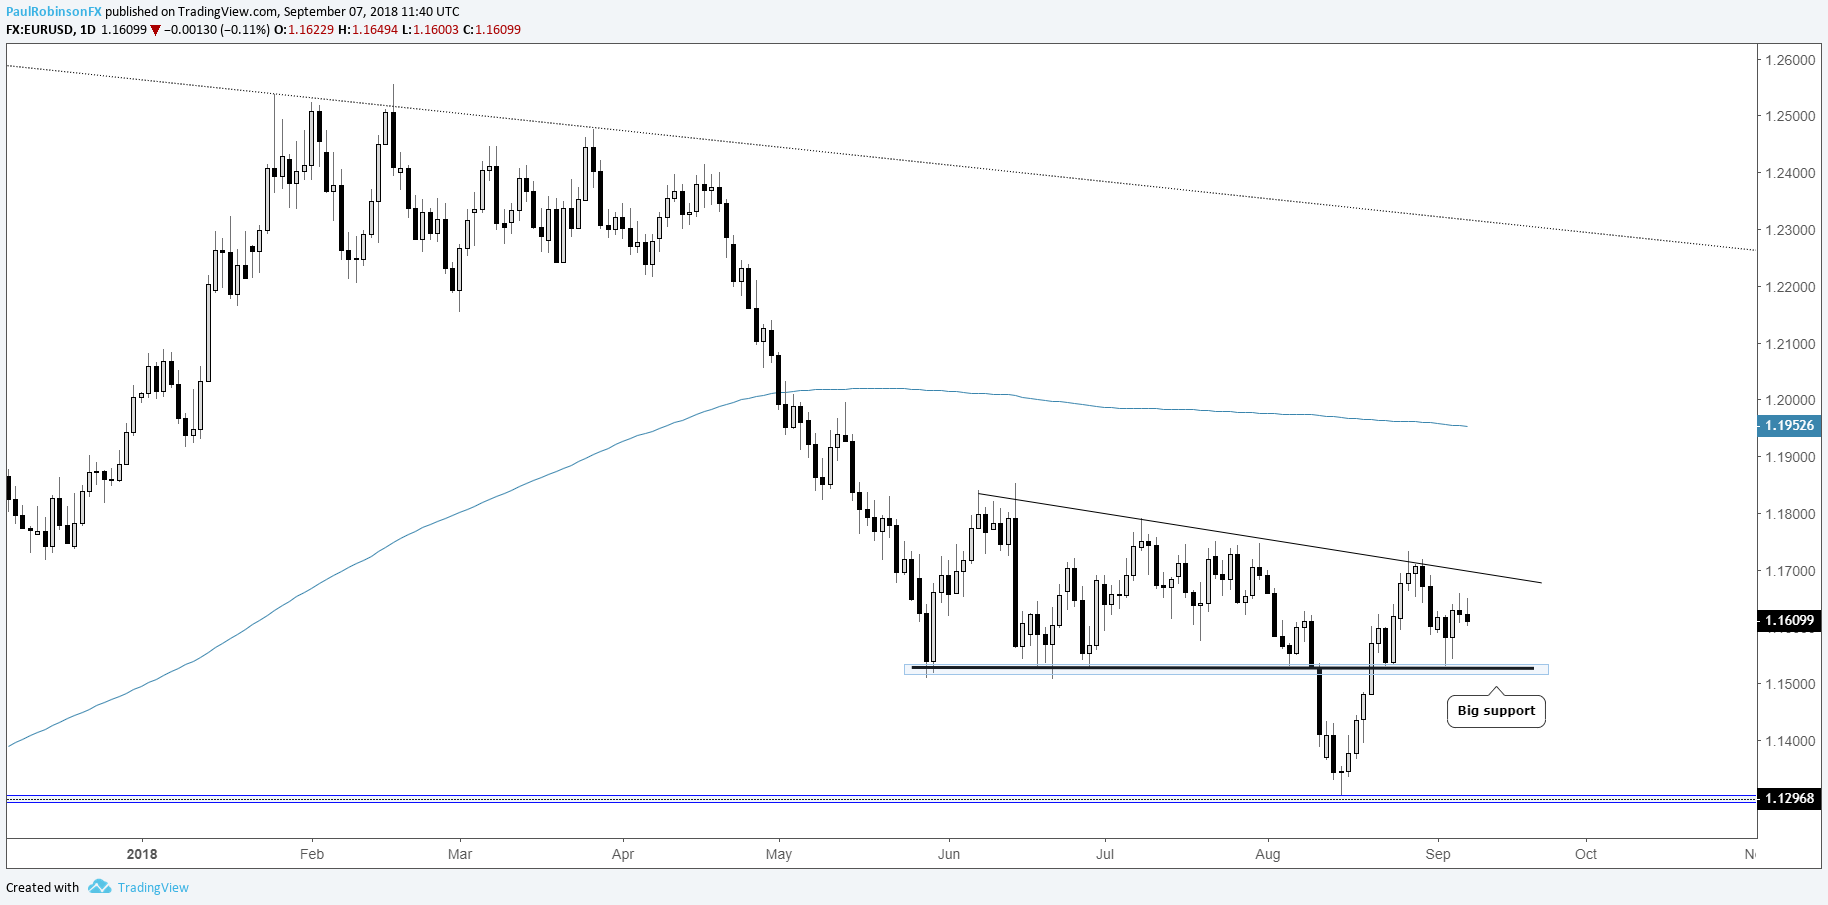
The euro runs the show with regard to the DXY, and as such it is essentially the index chart flipped upside down. 11500 remains a big floor for EUR/USD. To cement this week’s low as a higher low it will need to trade above trend-line resistance and take out 11733. The thinking is that we will see another leg higher soon, but want to wait for a little bit better price action before running firmly with this notion.
EUR/USD Daily Chart (11500 support)
To see what’s been driving the Dollar and Euro, check out the Quarterly Reports
GBP/CAD sparking intrigue on two time-frames
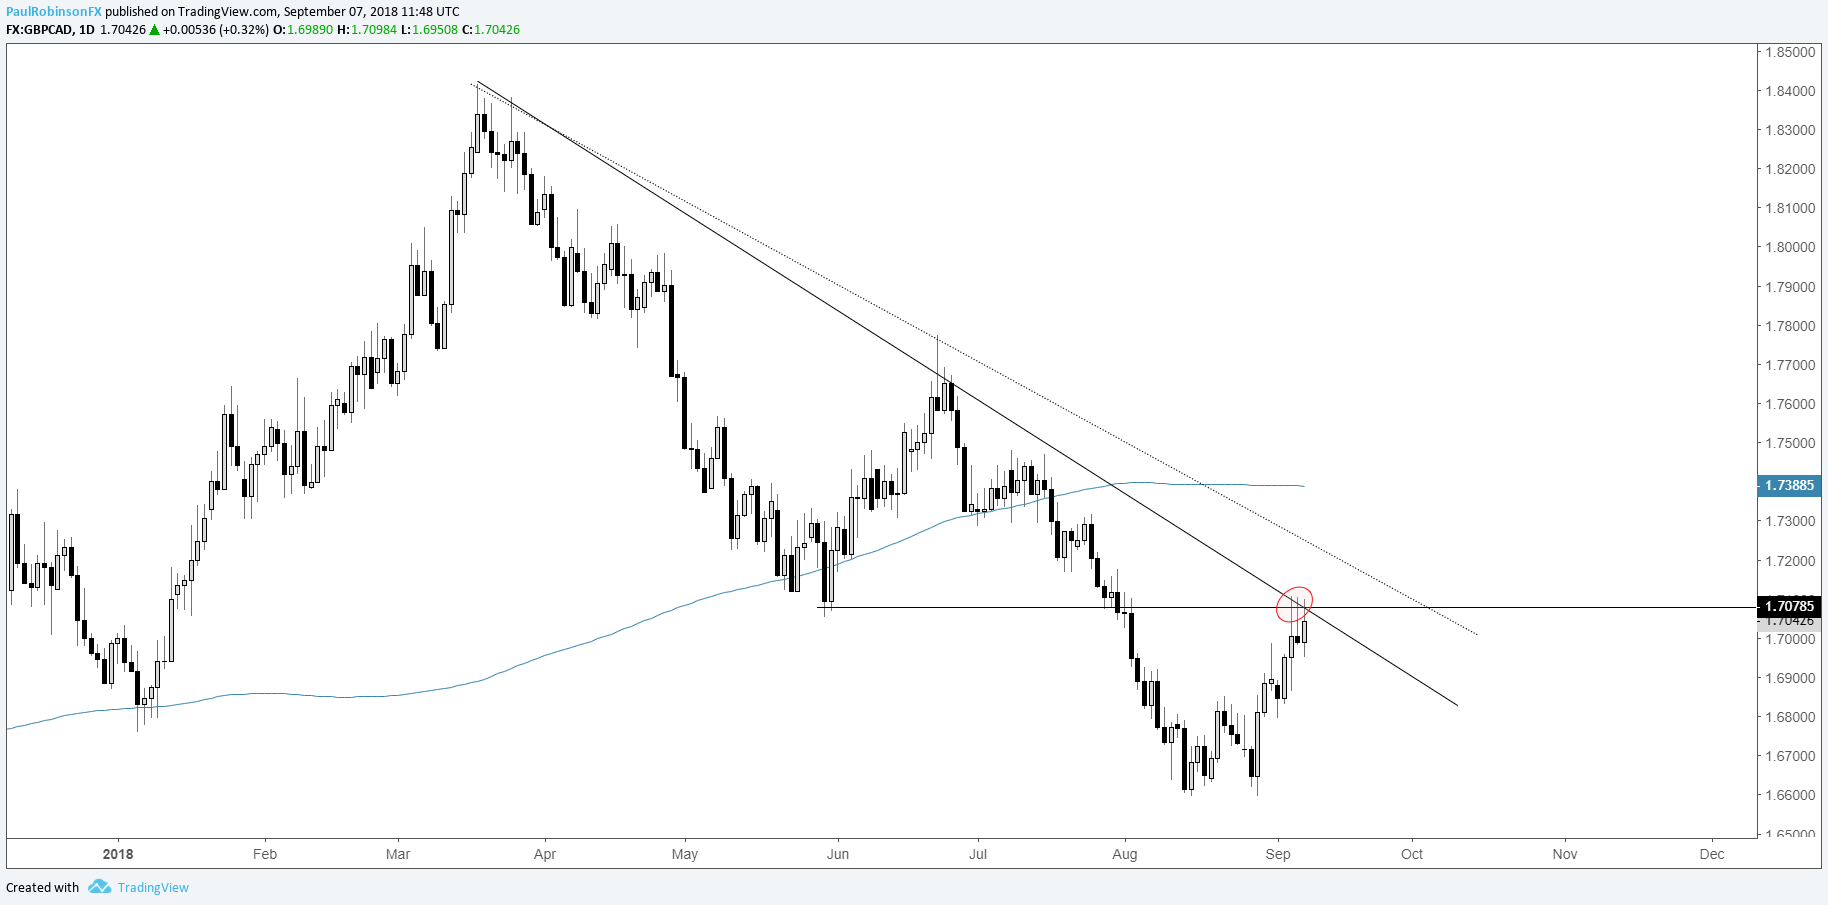
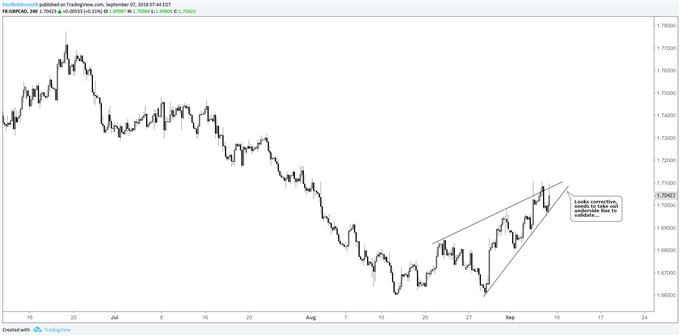
GBP/CAD posted a key-reversal yesterday at a trend-line from March and the low from May. This may soon be enough for the multi-month trend to resume. Dialing in on the 4-hr chart, there is a corrective-looking wedge forming. A firm break of the underside is viewed as a catalyst for kicking off a move lower.
GBP/CAD Daily Chart (Confluent resistance)
See what’s driving GBP in the Quarterly Pound Report
GBP/CAD 4-hr Chart (Corrective-looking wedge)
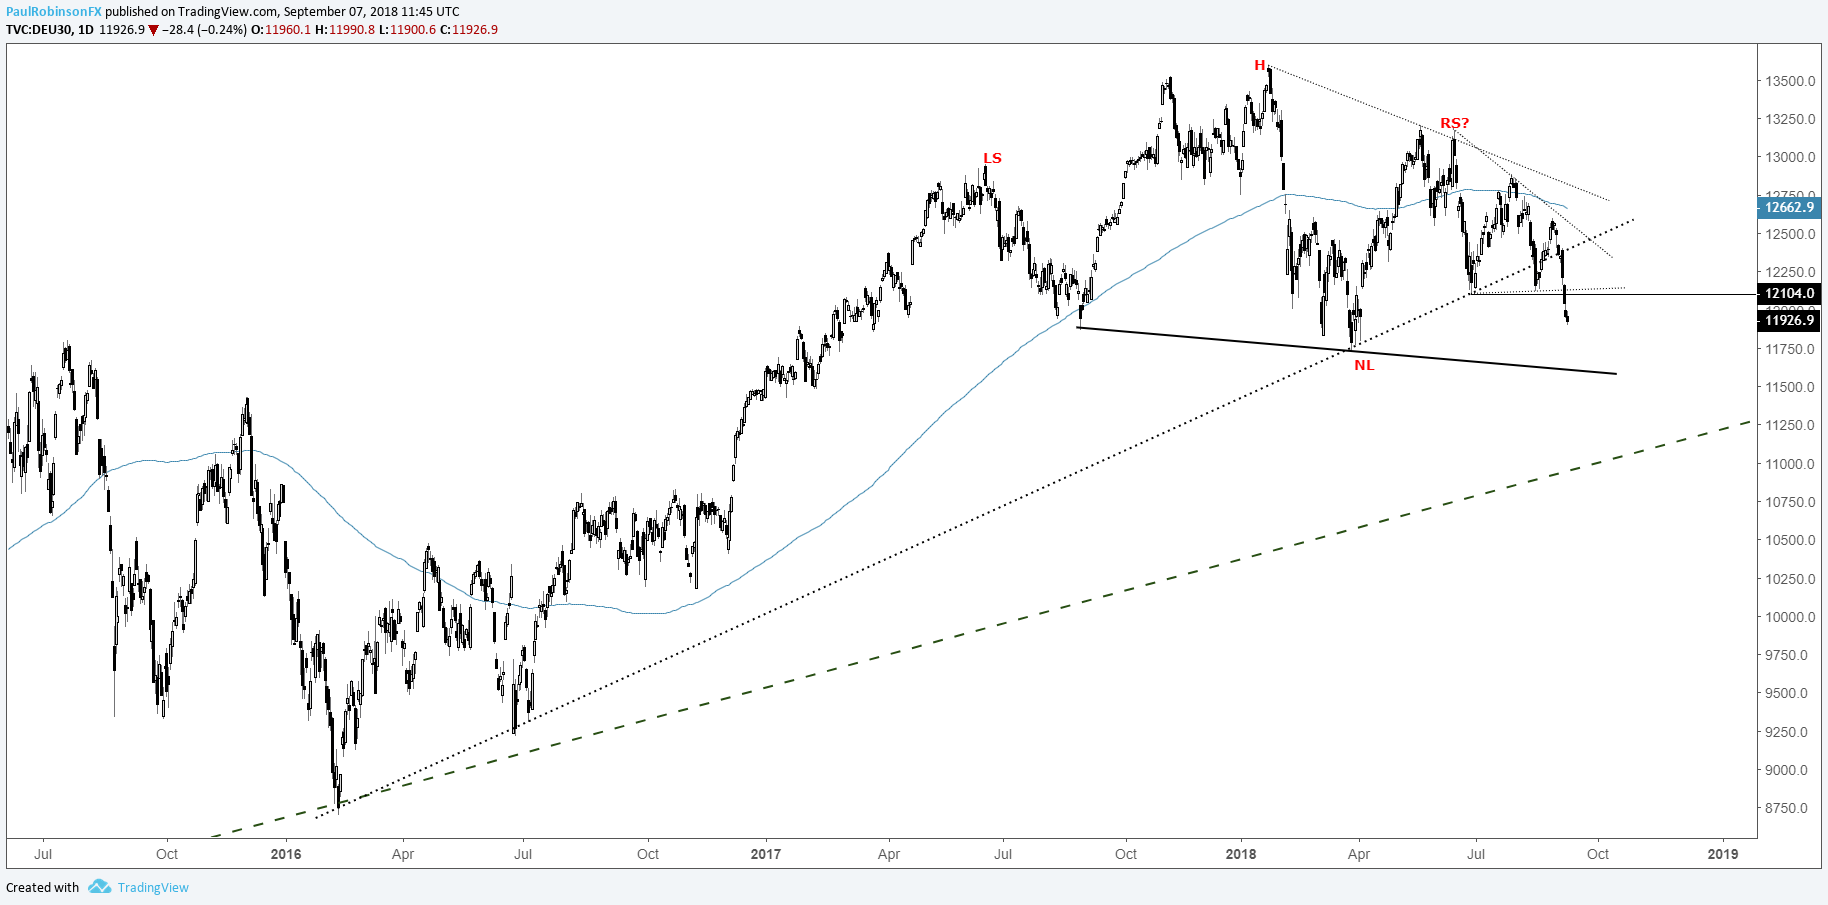
DAX trading towards important neckline test
As we discussed earlier in the week, if the DAX takes out 12104, which it did on Wednesday, that the risk becomes a thorough testing of the neckline of a 15-month head-and-shoulders pattern. This would be a major test, as a break is likely to mean global stocks as a whole are rolling downhill with force. The neckline resides around 11600. Keep an eye on the Nasdaq 100.
DAX Daily Chart (neckline test nearing)
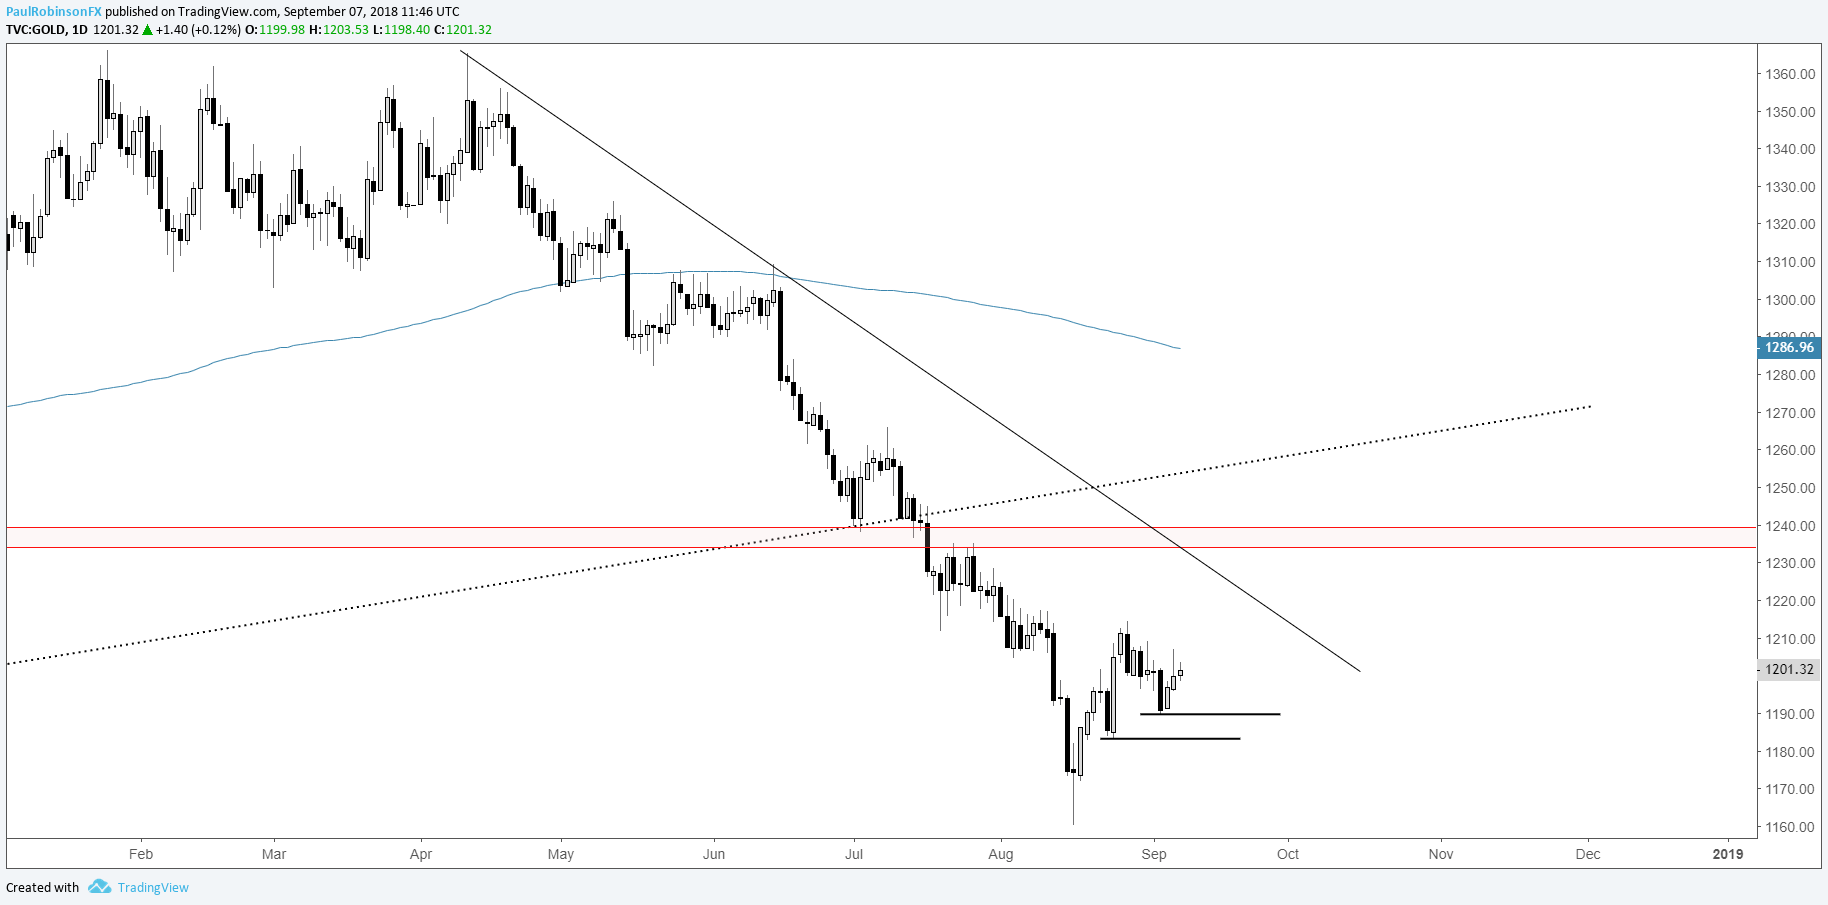
Gold price in limbo; higher low or rolling over?
Gold is a bit of a tough handle here, but as long as 1189 holds we may have seen another higher low. A break of 1189 will bring in one level of support at 1183 before in all likelihood gold is ready to trade back towards last month’s low. Tentatively bullish, but conviction lacking…
Gold Daily Chart (1189, 1183 in focus)
To find out what’s been driving gold, check out the Quarterly Gold Report
Resources for Index & Commodity Traders
Whether you are a new or an experienced trader, DailyFX has several resources available to help you; indicator for tracking trader sentiment, quarterly trading forecasts, analytical and educational webinars held daily, trading guides to help you improve trading performance, and one specifically for those who are new to forex.
---Written by Paul Robinson, Market Analyst
You can follow Paul on Twitter at @PaulRobinsonFX


