


Several major markets are at or very near major long-term trend-lines or levels. With this in mind, even if trading on shorter-term time-frames, right now is an important time to pay attention to the long-term charts. Gold is at a 3-year trend-line, crude oil is approaching a 10-year trend-line, and the DAX & S&P 500 are both at 2.5-year bull-market thresholds. That’s just in these markets. Generally, the feeling is that July could turn out to be a very pivotal month for the remainder of the year.
Technical Highlights:
- Gold trying to hold 2015 trend-line, December low
- Crude oil is a monster, eyeing the 2008 trend-line
- DAX & S&P 500 very near key bull market tests
We just released fresh quarterly forecasts, to see our fundamental and technical insights on major markets and currencies, check out the DailyFX Q3 Forecasts.
Gold trying to hold 2015 trend-line, December low
The downhill move in gold has the precious metal thoroughly testing the 2015 trend-line and December low we were targeting. At this juncture, the market is not only at big support but oversold with it having fallen $70 without a bounce.
Tactically, for those who are short this is a spot to start turning cautious at, and for would-be longs this is an area which holds promise from both a bias standpoint and risk/reward (you know where your ‘line-in-the-sand’ lies.)
Gold Daily Chart (2015 t-line, December low)

For more in-depth fundamental and technical analysis, check out the Q3 Forecast for Gold
Crude oil is a monster, eyeing the 2008 trend-line
The fierce rally in crude oil is bringing into view a major trend-line which runs down off the 2008 record high over yearly highs in 2013 and 2014. It lies in the 79-area, but given its long-term nature we need to give it a little wiggle room. Ideally, should we see oil trade to the trend-line (a likely outcome at this point), we see volatile price action which points to a top. A situation we’ll continue to monitor closely…
US Crude Oil Weekly Chart (2008 trend-line)

For more in-depth fundamental and technical analysis, check out the Q3 Forecast for Crude Oil
DAX & S&P 500 very near key bull market tests
This morning, we took a look at the DAX and its crucial test of the February 2016 trend-line and what it would mean if it broke. A big neckline test of the broad 1-yr+ head-and-shoulders pattern would likely be in store. A break could lead to a sizable decline, especially if the S&P 500 breaks its own major bull-market thresholds. Levels to watch in the near-term are 12104 and the 12550/600-area.
DAX Daily Chart (Feb '16 t-line, H&S neckline below)

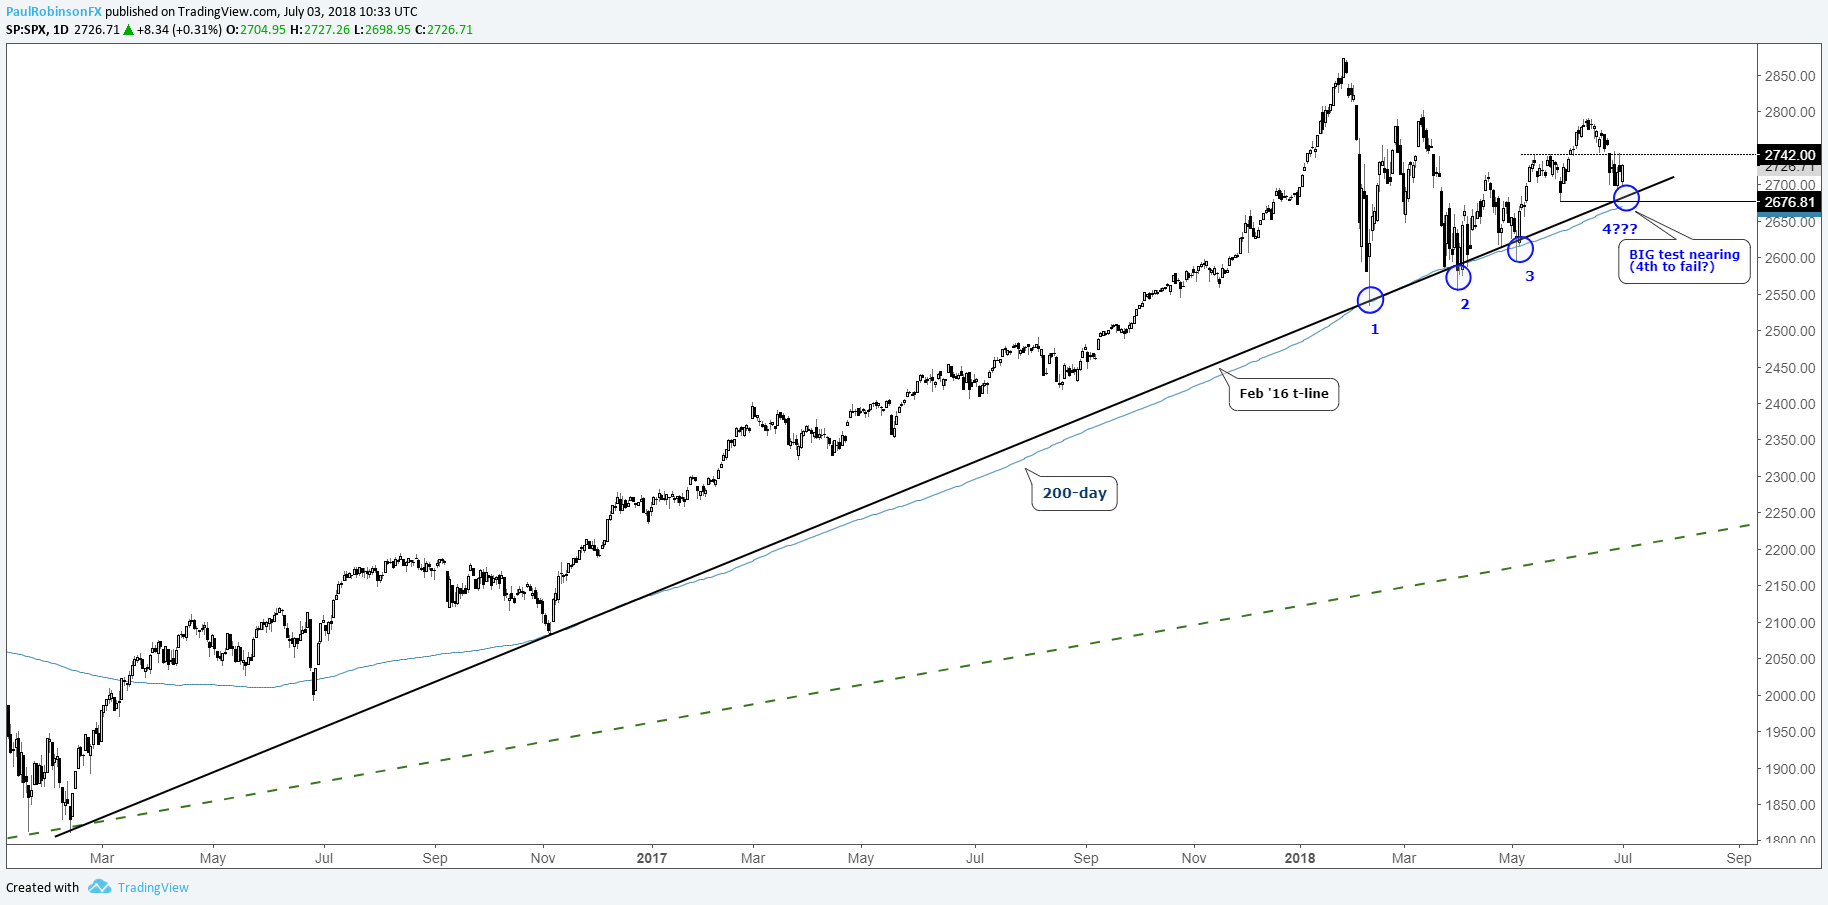
The S&P 500 has not only the February 2016 trend-line just at its feet, but running in confluence is the widely-watched 200-day MA. This makes for a very strong level of trend support. It’s been tested on three occasions this year, but a fourth test may prove to be too much in such a short span of time. A breakdown will likely have global markets rolling downhill during what is now the weakest time of the year for stocks into October. For now, though, as long as it holds we’ll respect it as support.
S&P 500 Daily Chart (4th test looks near, can it pass?)
For more in-depth fundamental and technical analysis, check out the Q3 Forecast for Global Equity Indices
Resources for Index & Commodity Traders
Whether you are a new or an experienced trader, DailyFX has several resources available to help you; indicator for tracking trader sentiment, quarterly trading forecasts, analytical and educational webinars held daily, trading guides to help you improve trading performance, and one specifically for those who are new to forex.
---Written by Paul Robinson, Market Analyst
You can follow Paul on Twitter at @PaulRobinsonFX


