


Gold prices tested $1302 and bounced while crude oil prices continue to trend higher. The Elliott Wave patterns we are following imply a dip in gold before a stronger rally while crude oil tops off its current up trend.
The video above is a recording of a US Opening Bell webinar from May 7, 2018.
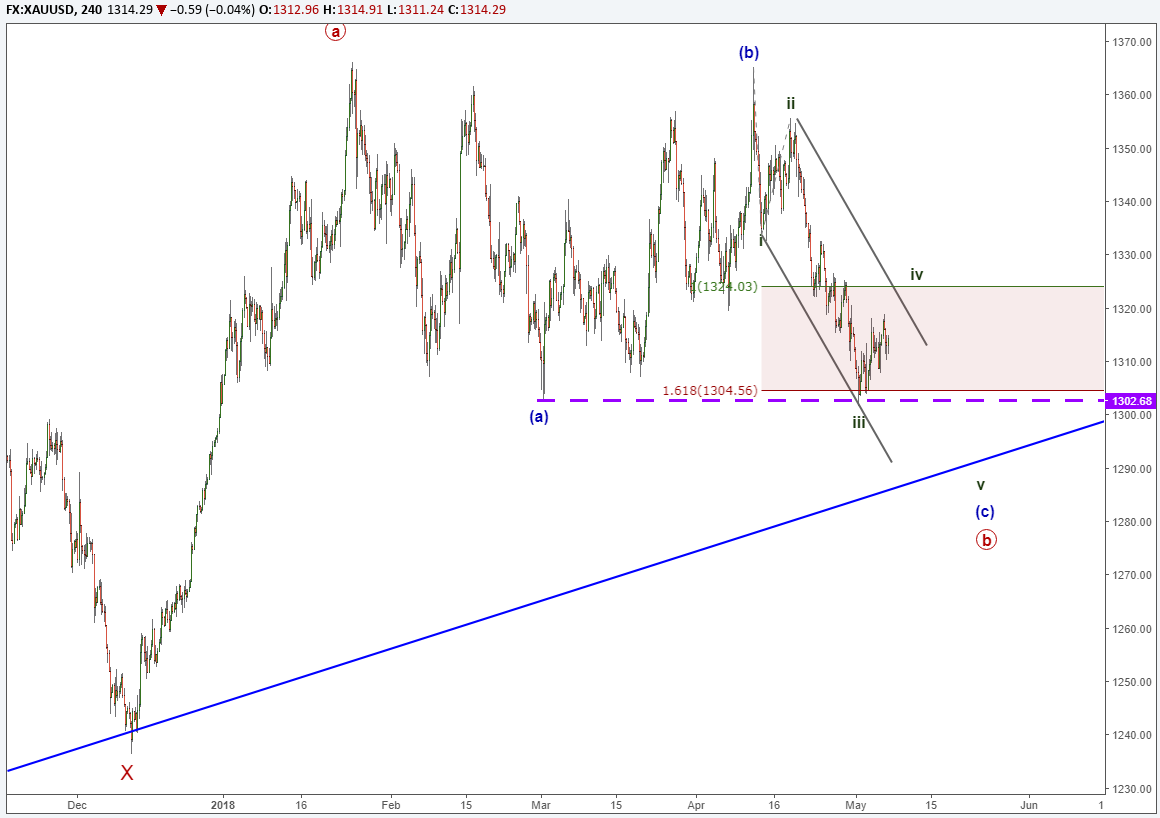
Elliott Wave Analysis for Gold
The larger trend in gold prices appears incomplete to the upside. The consolidation in the gold price chart from January 2018 to now appears to be a sideways consolidation prior to one last spike higher. At what point on the gold chart will this last bump higher begin?
Many times on a consolidation pattern like this, prices flush out the range then reverse creating a double fake out. In this case, it would be a flush out to the down side attracting shorts with the potential to reverse higher and break to new highs above $1365.
This sideways consolidation is counting best as a sideways flat pattern that subdivides as (a)-(b)-(c). The (c) wave would need five waves and it appears we are in the fourth wave right now. Therefore, one more blast to the downside open the door for a bullish reversal to retest $1365.
Crude Oil chart still unfinished to the upside
Crude oil prices have continued to trade near recent highs. Using the Elliott Wave Theory as our guideline for analysis, we are showing a trend that is closer to the end than the beginning. The W-X-Y complex correction that began in 2016 is approaching its terminal point.
There are several wave relationships appearing in the $71-$74 per barrel. Wave ‘Y’ is equal in length to wave ‘W’ near $71.18. Wave relationships of wave (c) of ‘Y’ fill in from $71 to $74. There is some question as to the shape of wave (b) of ‘Y’ and that makes it difficult to dial in a closer price zone for a potential reversal.
If a reversal in crude oil prices takes hold, then we may see a deep correction in the latter part of calendar year 2018.

USDJPY Elliott Wave Chart
USDJPY has started a new trend on March 25 with an impulse wave. According to Elliott Wave Theory, this pattern appears incomplete to the upside and may ultimately test 118. The USDJPY chart is running into some resistance as a 2012 trend line that suppressed prices last week. Our preferred Elliott Wave count is that USDJPY may eventually find the strength to burst higher in a small degree wave 5. The key level to the bullish outlook is 107.46 area. Much below 108 and we can begin to elevate the alternate count that suggests this current uptrend may only be wave ‘b’ of (y).

USDJPY sentiment analysis aligns with the Elliott Wave chart. The current live sentiment reading is near +1.3 and is hovering near its lowest levels in over four months. We use sentiment as a contrarian signal so when it is relatively low, that acts as a bullish signal for USDJPY.
Elliott Wave Theory FAQs
What are Elliott Wave impulse waves?
According to Elliott Wave Theory, the market moves five waves in the direction of the near term trend followed by a three wave counter trend wave. An impulse wave is one of two types of motive waves that denotes trend direction. Therefore, if we see a bearish impulse waveform, then after a three-wave counter trend wave, we can anticipate at least one more bearish motive wave.
For those Elliott Wave technicians looking for further study, read about our expert tips in our beginners and advanced trading guides.
After reviewing the guides above, be sure to follow future Elliott Wave articles to see Elliott Wave Theory in action.
What is the biggest mistake traders make?
Regardless of the style of analysis, many traders do lose money because they do not take the time to study the market and the effect of leverage. At DailyFX, we have studied millions of live trades and boiled our study down into a Traits of Successful Traders guide. You will find how leverage and human nature affects our trading so you can be better prepared for the next correction.
Elliott Wave Theory can be applied to a variety of highly liquid markets. FX is one of my favorite markets to apply the Elliott Wave principle. Learn more about trading FX with this guide specifically designed for you.
---Written by Jeremy Wagner, CEWA-M
Jeremy Wagner is a Certified Elliott Wave Analyst with a Master’s designation. Jeremy provides Elliott Wave analysis on key markets as well as Elliott Wave educational resources. Read more of Jeremy’s Elliott Wave reports via his bio page.
Communicate with Jeremy and have your shout below by posting in the comments area. Feel free to include your Elliott Wave count as well.
Discuss these markets with Jeremy in Monday’s US Opening Bell webinar.
Follow me on Twitter at @JWagnerFXTrader .
To receive additional articles from Jeremy via email, join Jeremy’s distribution list.


