


The Elliott Wave analysis for EURUSD and USDJPY shows a higher probability move towards USD strength.
The video above is a recording of a US Opening Bell webinar from April 9, 2018.
Elliott Wave Analysis for EURUSD
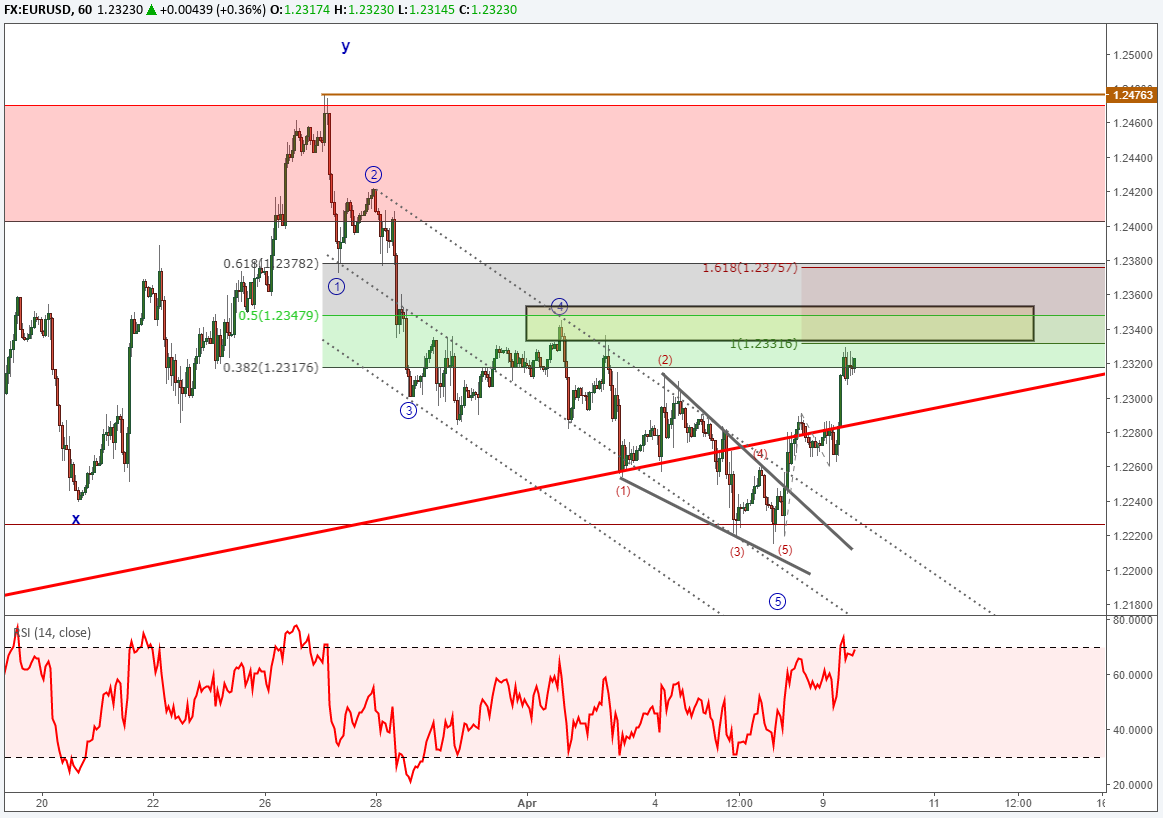
Since January 2018 we have been anticipating that a three year expanded flat pattern is ending and that a multi-month high hangs around the corner. On March 19, we established a pending order to short on a EURUSD break down at 1.2153 that has yet to trigger. We will continue with the pending order so long as EURUSD is below 1.2556.
Last week, we saw a temporary break of the red upward sloping trend line. This hints at a weak market. According to the Elliott Wave Principle, we can also identify a complete bearish impulse wave that began March 27 and ended on April 6. This bearish impulse wave sports alternation between waves ‘2’ and ‘4’ as well as an ending diagonal pattern in wave ‘5’.
Elliott Wave ending diagonal patterns typically retrace swiftly back to their origination. The beginning of this ending diagonal occurred at 1.2345. This price zone is also shielded by the 50% Fibonacci retracement level at 1.2348. Therefore, this price zone near 1.2350 may act like a magnet to attract prices up towards this level.
EURUSD Sentiment Analysis
EURUSD sentiment has continued to increase from last week’s -1.4 to the current live reading near -1.3. Early today it was even higher at -1.2. Since sentiment is a contrarian signal, this increase in the reading is a clue about a falling EURUSD. If EURUSD does work down towards 1.2153 we would like to see continued evidence of sentiment shifting up higher than -1.3 and that would be a bearish signal.
If a trader is unwilling to wait for a more conservative entry at the 1.2153 break out level, then they could consider a short entry in the 1.2330-1.2380 price zone. If entered in this upper price zone, it may be best to probe the market with a small trade entry rather than risking the full trade size. Risk to the near term sell off can be placed just above the March 27 high near 1.2480.
USDJPY Elliott Wave Chart
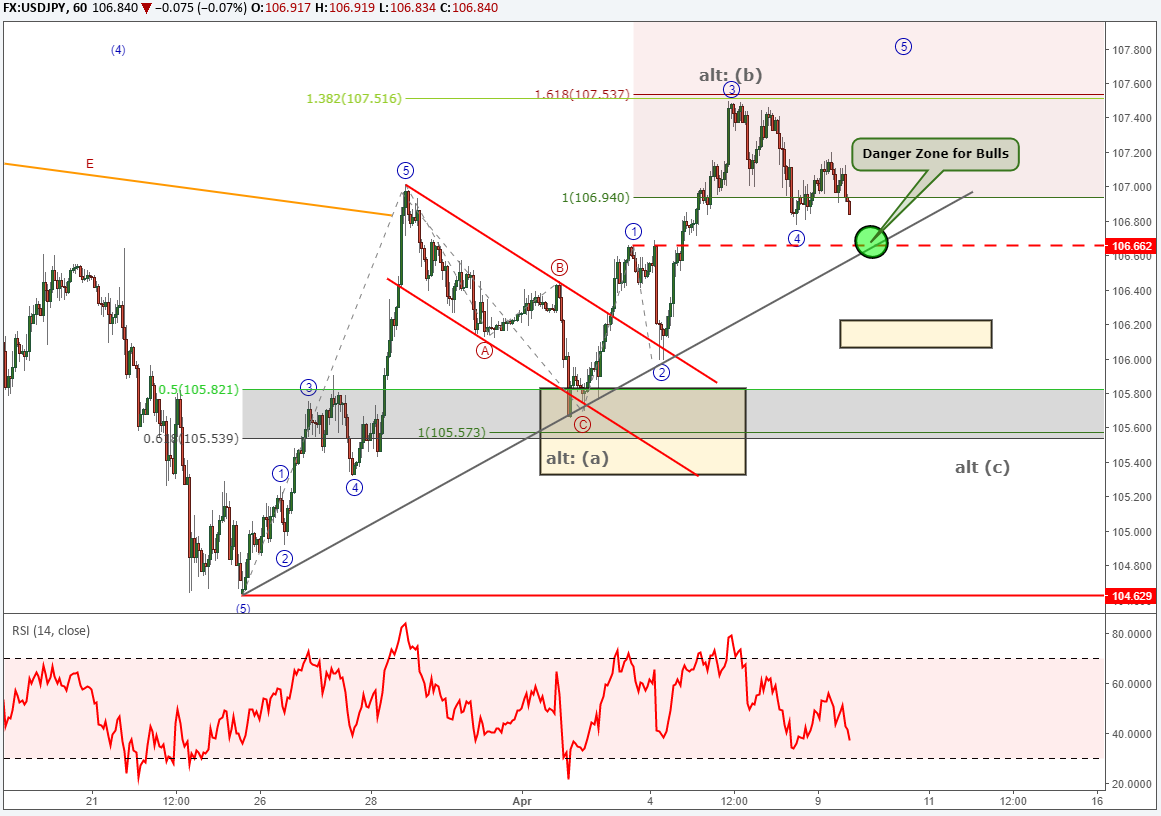
USDJPY has started a new trend on March 25 with an impulse wave. According to Elliott Wave Theory, we are anticipating another wave of similar size. The preferred wave count at the moment is that this may bottom soon for a fifth and final wave higher.
I have highlighted a price zone near 106.66 as a danger zone for the bulls. If price breaks below this level, the near term bullish picture is negated and USDJPY has a high probability pattern of reaching 106.10.
So long as USDJPY is holding above 106.66, then we can anticipate a fifth and final wave higher.
USDJPY sentiment has fallen from last week’s lofty levels and currently rests at +1.8. This fall in sentiment is a reflection of an increase in the number of short traders coupled with a decrease in the number of long traders. This could be a subtle shift below the surface and if sentiment continues to fall, could signal higher prices for USDJPY. Keep an eye on the IG live client sentiment reading.
Elliott Wave Theory FAQs
What are Elliott Wave impulse waves?
According to Elliott Wave Theory, the market moves five waves in the direction of the near term trend followed by a three wave counter trend wave. An impulse wave is one of two types of motive waves that denotes trend direction. Therefore, if we see a bearish impulse waveform, then after a three-wave counter trend wave, we can anticipate at least one more bearish motive wave.
For those Elliott Wave technicians looking for further study, read about our expert tips in our beginners and advanced trading guides.
After reviewing the guides above, be sure to follow future Elliott Wave articles to see Elliott Wave Theory in action.
What is the biggest mistake forex trader make?
Regardless of the style of analysis, many traders do lose money because they do not take the time to study the market and the effect of leverage. At DailyFX, we have studied millions of live trades and boiled our study down into a Traits of Successful Traders guide. You will find how leverage and human nature affects our trading so you can be better prepared for the next correction.
Elliott Wave Theory can be applied to a variety of highly liquid markets. FX is one of my favorite markets to apply the Elliott Wave principle. Learn more about trading FX with this guide specifically designed for you.
---Written by Jeremy Wagner, CEWA-M
Jeremy Wagner is a Certified Elliott Wave Analyst with a Master’s designation. Jeremy provides Elliott Wave analysis on key markets as well as Elliott Wave educational resources. Read more of Jeremy’s Elliott Wave reports via his bio page.
Communicate with Jeremy and have your shout below by posting in the comments area. Feel free to include your Elliott Wave count as well.
Discuss these markets with Jeremy in Monday’s US Opening Bell webinar.
Follow me on Twitter at @JWagnerFXTrader .
To receive additional articles from Jeremy via email, join Jeremy’s distribution list.


