


S&P 500, EURUSD, USDJPY, Growth Forecasts and Rate Hike Talking Points
- The Trade Perspective: S&P 500 Bearish Below 4,075; USDJPY Bearish Below 132.00
- The wind up in the S&P 500 after a narrow eight days of trade finally led to a bearish break into the New York close Thursday
- Follow through on risk aversion and the EURUSD’s break through its own range floor at 1.0635 depends on US CPI’s ability to charge FOMC expectations next week

Finally…Some Movement in Risk Assets
It has been a very quiet week for price action – up until this past session. While the economic docket has offered up some remarkable event risk to digest like the sharp downgrades in OECD and World Bank growth forecasts, speculative benchmarks have refused to budget from their range. That changed in particular through the close of the New York session Thursday. On a day that one of the world’s most dovish central banks – the ECB – signaled that it would join its major peers in their fight against rampant inflation, speculative interests were shaken from their beneficial complacency. The building fundamental pressure facing the world economy and financial system cracked open enough fear to push the S&P 500 through the floor of its 100-point range below 4,075. The move we registered was significant at -2.4 percent. What’s more, the pressure was not just isolated to that singular index or US equities as an asset class. Most of the measures I track for ‘risk’ guidance slid. Yet, technical breaks are not the definitive drive for trend. Follow through into Friday, much less beyond, is complicated.
Chart of S&P 500 with 50-Day SMA, 7-Day ATR and 7-Day Historical Range (Daily)
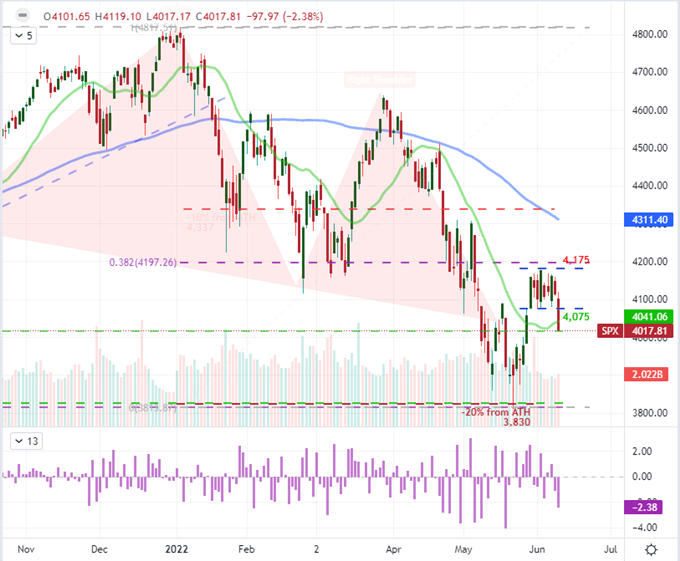
Chart Created on Tradingview Platform
It can be frustrating for traders that consult technical analysis solely, because it is commonplace to see what seems a major level or barrier give way only to find the market dry up immediately after the spark is struck. A healthy appreciation of the fundamental conditions can help to better shape expectations for whether momentum will follow or not. While I find the SPX break to be significant particularly with the reinforcement of the EURUSD’s slide, there is complication for those looking to simply feed off the speculative response in the void that is anticipation. There is major event risk on the docket for next week. Ultimately, there are a range of major central bank policy decisions, but it is the Fed’s expected 50bp hike and updates to its growth/inflation/rate forecasts that truly threatens the peace. While most analysis is saved for the expected impact of an event after it occurs, I find there is greater consistency in the curb on activity that occurs before the headlines are made. There is an opportunity to override – or more accurately capitalize on – the market’s Fed focus in the US inflation report. CPI is the market’s favorite inflation indicator, and a surprise can alter already-sensitive rate forecasts. For risk assets, I think there is greater capacity for movement if the report is ‘hotter’ (higher) than expected which will cement an aggressive rate forecast, feeding a theme that seems to have contributed to this past session’s drop.
Calendar of Major Economic Events
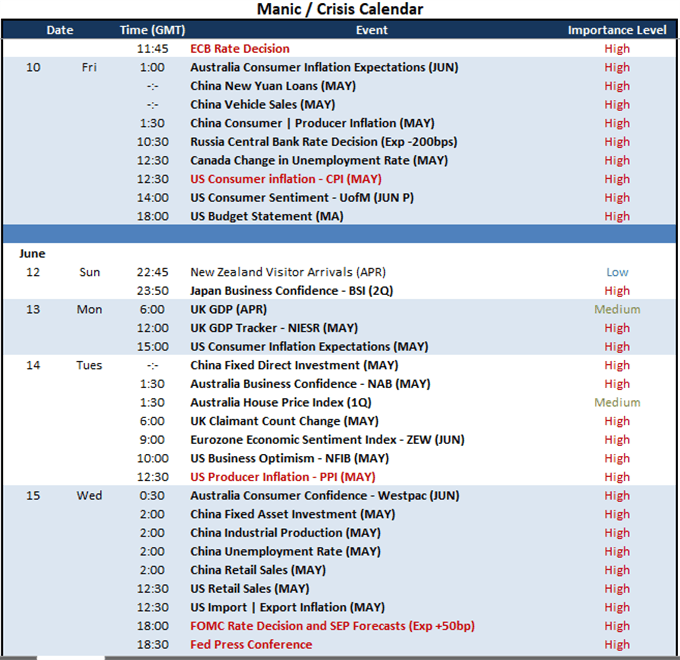
Calendar Created by John Kicklighter
Leveraging Monetary Policy for Market Movement
While there seems good potential to leverage the upcoming inflation data for significant movement from the S&P 500 and other risk assets on the right outcome, I believe the Dollar’s response is more likely to struggle. Like the world’s most popular index, the benchmark exchange rate managed to finally break its own tight, 11-day range. EURUSD slipped 1.0635 on a day where the European Central Bank (ECB) seemed to join its largest counterparts in the fight against inflation. That said, they did so with a muddle voice and the market seemed to have decided that this outcome was already inevitable…and perhaps less aggressive than they had anticipated. While the world’s second largest central bank is now looking to move to a positive benchmark rate with the forecast through year’s end now pricing in a benchmark of approximately 0.90 percent, there is greater recognition that perhaps they are far behind the inflation fight, raising the risk of a recession born of price pressures. In the message of the hawkish rhetoric, there remained inconsistency in the group’s views of what the correct path forward was. It makes sense therefore that not only did the Euro struggle for lift, but European spreads grew while the DAX and other European indices slid.
Chart of EURUSD with 20 and 100-day SMAs, 11-Day Historical Range (Daily)
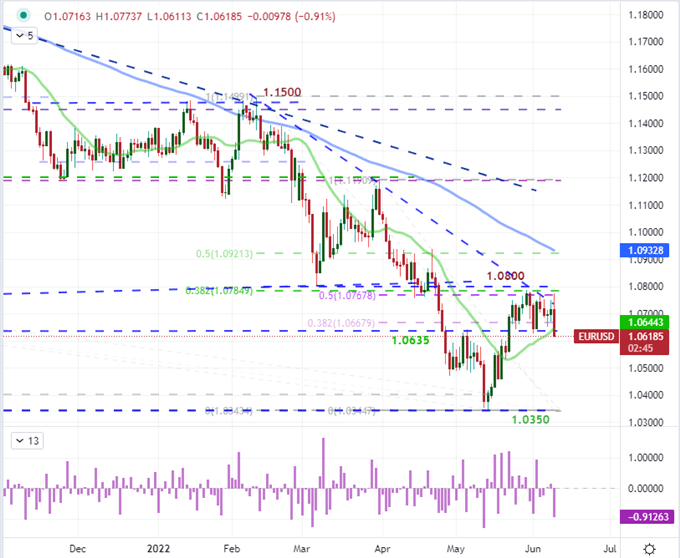
Chart Created on Tradingview Platform
Taking into context the ECB’s shift in policy, we have seen one of the long holdouts against a hawkish shift falter to persistent and dangerous inflation. If you are looking to FX or other relative measures of value, there is certainly a consideration of yield advantage that will attract speculative appetite. That said, for pairs like AUDNZD or USDCAD, the differentials are extremely narrow. The exception of course seems to be the Yen crosses where the charge over the past month in particular is evident across the board. From another perspective, the collective view of hawkish bias carries with it the cumulative reality of unyielding inflation, tighter financial conditions and slowing economic activity. Under these circumstances, the potential for full risk aversion tipping off is growing while the extent of the retreat is likely to be significantly lower than what is current appreciated in the broader market.
Chart of Major Central Banks’ Benchmark Lending Rates (Monthly)
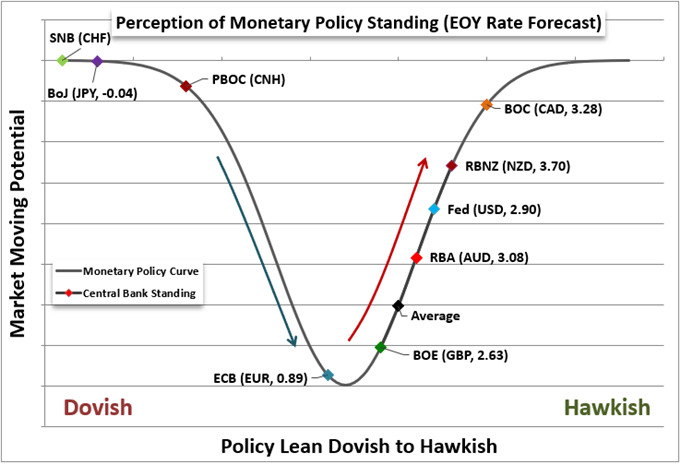
Chart Created by John Kicklighter
The Role of the USDJPY
Ultimately, I believe the major fundamental themes that are jostling for market influence these past months will lead to risk aversion via a systemic concern over the potential for recession later in 2022 or early 2023. Yet, for now, the market’s more immediate attention can flip between big picture and short-term opportunism depending on the event risk at play and short-term circumstances. One consideration that I believe is very important to keep track of in order to have a better short-term bead on the market’s priorities is whether interest rate expectations are exerting greater influence than general risk trends. A measure that I frequently refer to for this assessment is USDJPY. The carry trade differential is as strong here as anywhere and the momentum is persistent. Further, the premium built up behind this speculative reach is arguably extreme as the pair pushes a two decade high. As such, I think there is a greater potential for a significant – large and aggressive – bearish move versus a more controlled appreciation if carry trade somehow finds more lift through greater hikes and/or a relief risk rally.
Chart of USDJPY with 50 and 100-Day SMAs and ‘Tails’ (Daily)
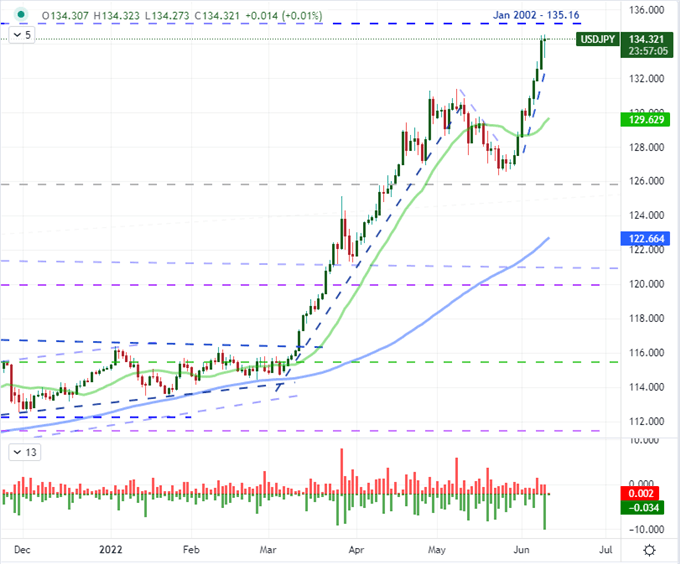
Chart Created on Tradingview Platform


