


S&P 500, USDMXN, USDJPY and CADJPY Talking Points
- The Trade Perspective: CADJPY Bearish Below 96; GBPJPY Bearish Below 159; GBPAUD Bullish Above 1.7700
- Some bulls have been heartened by the S&P 500 putting in for a 1.4 percent rally – 6th 1 percent or greater rally in 8 days – but there remains an explicit lack of traction
- Rate expectations are swelling with the Fed seen hiking 50bps at both the May and June meeting; but besides USDJPY, the lift isn’t registering

Chop in the S&P 500 Continues Without a Clear Guide for Trend
Any lingering expectation that I may have had that the market would consider the 200-day moving average and midpoint of the S&P 500 range a meaningful technical level evaporated this past session with another rally from the index. The market has traversed these recognizable milestones three times without any apparent consequence. There are different ways of reading this market if you want to apply a pre-established bias. If you were reading the scene with a bearish eye, you can point out that momentum has stalled from last week’s charge and the 100-day SMA is at least still in place. With a bullish perspective, six of the past eight trading days have now registered gains of at least 1.0 percent – besides the 7-day consecutive stretch through early November 2020, that has only happened one other time in history. Ultimately, I see it as indecision with a lack of decisive motivation failing to catalyze technical patterns. This week’s range is only 2.2 percent of spot, which is the smallest weekly footprint since the last week of 2021 or holiday conditions. A break is absolutely possible from their narrow band through Friday, but follow through that carries into Monday and beyond requires a serious fundamental charge.
Chart of SPY S&P 500 ETF with Volume and 100-Day Mov Avg (Daily)
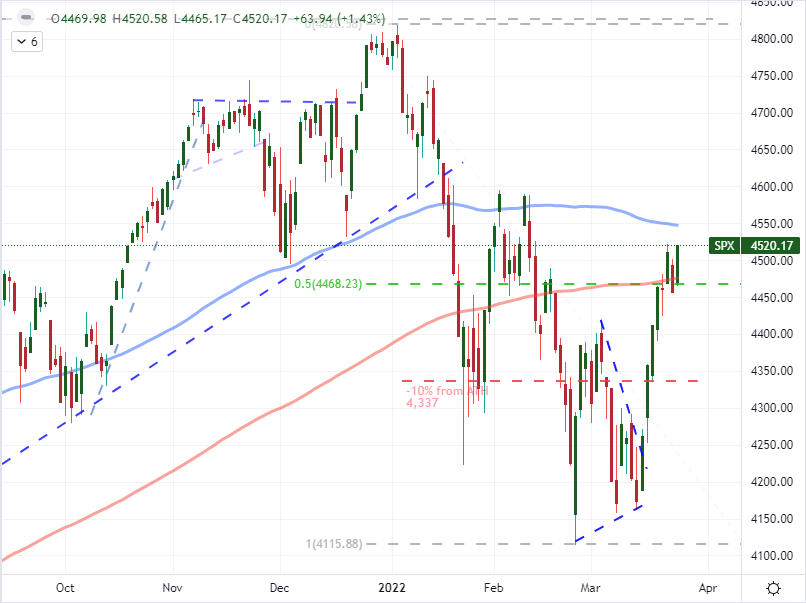
Chart Created on Tradingview Platform
If you were looking for a fundamental silver lining to help justify the modest bounce in risk assets this past session, the March PMIs from the major economies put out by Markit offered some buoyancy. While the Eurozone’s exposure to Russia’s assault on Ukraine, the other major economies showed improvement or held high levels. The US measure rose 1.2 points to 58.5 against expectations of a 1.0 point drop. That does not undo the warnings of impending growth forecast downgrades from some of the regional Fed banks, credit rating agencies and IMF; but it suggests the slip will come from a higher starting point. Ultimately, I don’t see this as particularly market-moving data as it doesn’t offset the eroded forecast; but I have seen speculative runs born of much less.
Chart of Monthly PMIs from Major Economies (Monthly)
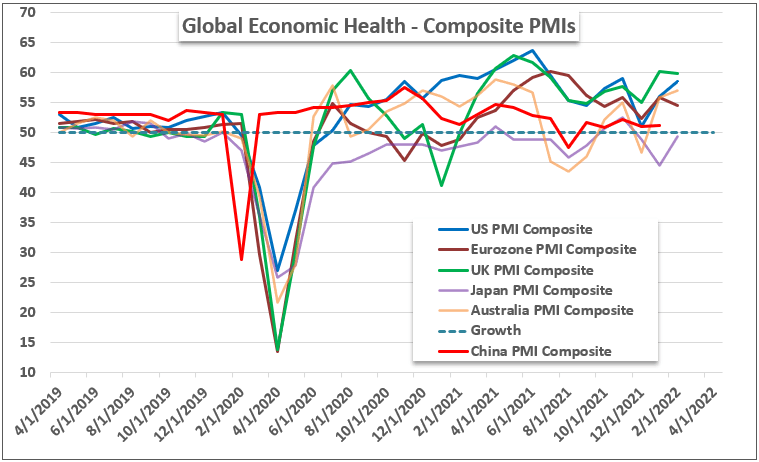
Chart Created by John Kicklighter with Data from Markit
Interest Rates on the Other Hand Keep the Pressure On
In contrast to the tepid enthusiasm that current growth measures are offering us, the outlook for monetary policy keeps ratcheting up expectations. While there were no official US stats that furthered the inflation concerns, there was plenty of Fed speak that was clearly aimed at warning the policy body would be moving forward with its fight against rising prices even if we entered turbulent market waters. While there were a range of Fed speakers on tap, the two that stood out to me were Chicago Fed President Charles Evans and Minneapolis Fed President Neel Kashkari. The later has said that he expects 7 quarter-point rate hikes this year but it is his view that a faster reduction in the Fed balance sheet should be pursued that real stood out. As for Evans, he too projected consecutive hikes through year end, but he also stated that the case could be made for 50 bp moves. These are arguably two of the most dovish policy members in the Fed. In turn, Fed Fund futures are now pricing in a 50 basis point hike on May 4th AND a 74 percent probability of a 50 basis point jump on June 15th. Despite this, the DXY Dollar Index is stuck in the mud.
Chart of DXY Dollar Index and 100-Day SMA Overlaid with May and June FOMC Rate Forecast
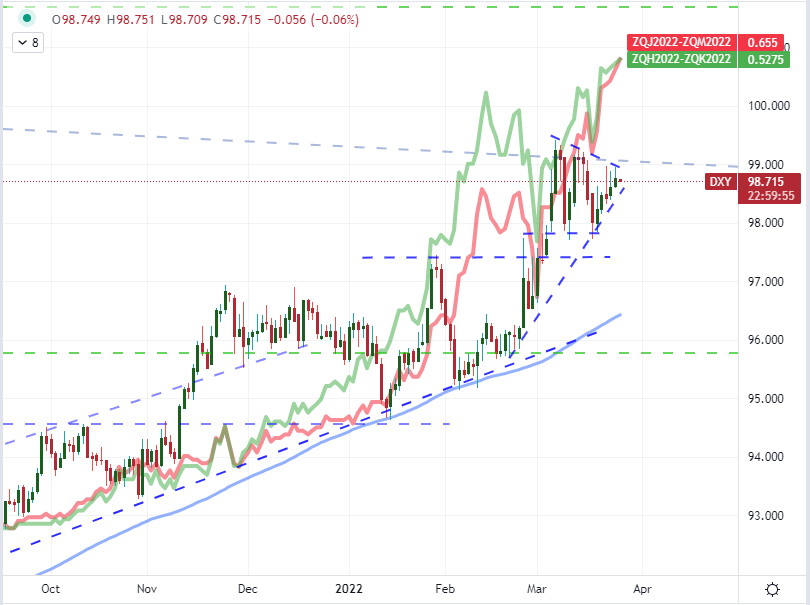
Chart Created on Tradingview Platform
Speaking of monetary policy updates, Fed speak wasn’t the only matter to tape into. The Swiss National Bank (SNB) was the biggest group on tap for Thursday and the group warned its inflation growing far too quickly which makes its view of a too-strong Swiss Franc even more difficult to swallow. Ultimately though, it was status quo on the action front from the bank. In contrast, the South African Reserve Bank (SARB) hiked rates 25 basis points to 4.25 percent as expected which helped accelerate the USDZAR’s four-day slide with limited technical consequences. The big story on the day was Banxico (Mexico’s central bank) which hiked rates 50 basis points to 6.50 percent. While that led USDMXN to its 8th consecutive day lower, the real news was that the move was announced hours ahead of the official policy statement by Mexican President Andres Manuel Lopez Obrador (AMLO). This is raising eyebrows and a few concerns about the independence of the bank.
Chart of USDMXN with 20-Day SMA and Consecutive Candles (Daily)
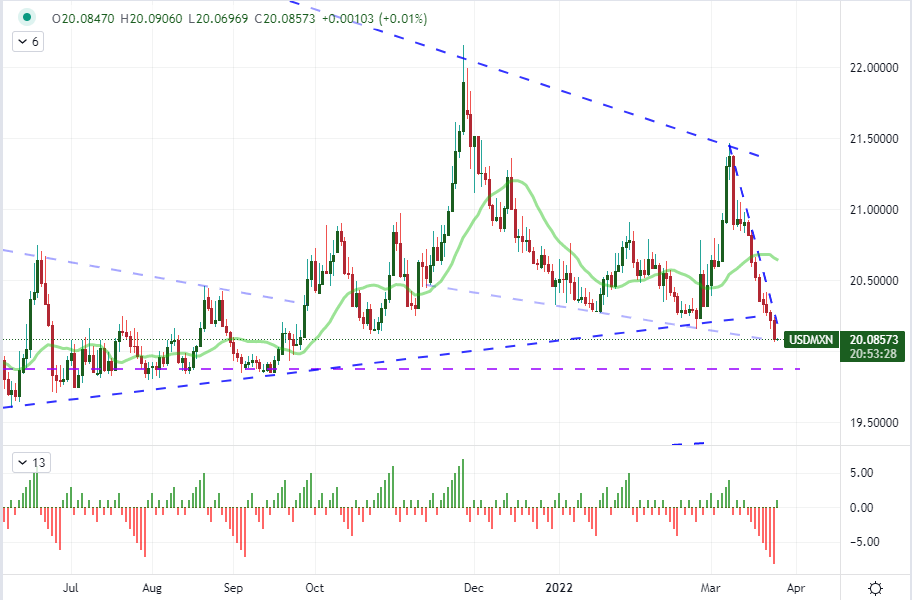
Chart Created on Tradingview Platform
The Yen Fire Continues to Burn
As the S&P 500 and Dollar keep up their struggle to find meaningful traction despite prevalent fundamental drivers, the Yen crosses continue to synthesize anything and everything into lift. This looks to have fully shifted from a genuine fundamentally-driven market charge into a momentum cycle. This will eventually break, but the question is whether the next phase is a plateau or reversal. General market conditions suggest the former, but this is so extreme that it seems the latter is a very serious risk. CADJPY continues to top the charts for me in these crosses with a now 12-day unbroken advance. That is a record for this pair. That alone isn’t enough to say markets are stretched, but the difference between spot and the 20-day moving average certainly suggests as much. I am watching to see if Japanese authorities make a stealth effort to intervene, fiscal year-end activity to disrupt or just a speculative falter.
Chart of CADJPY with 200-Day Moving Average and Consecutive Candle Count (Daily)
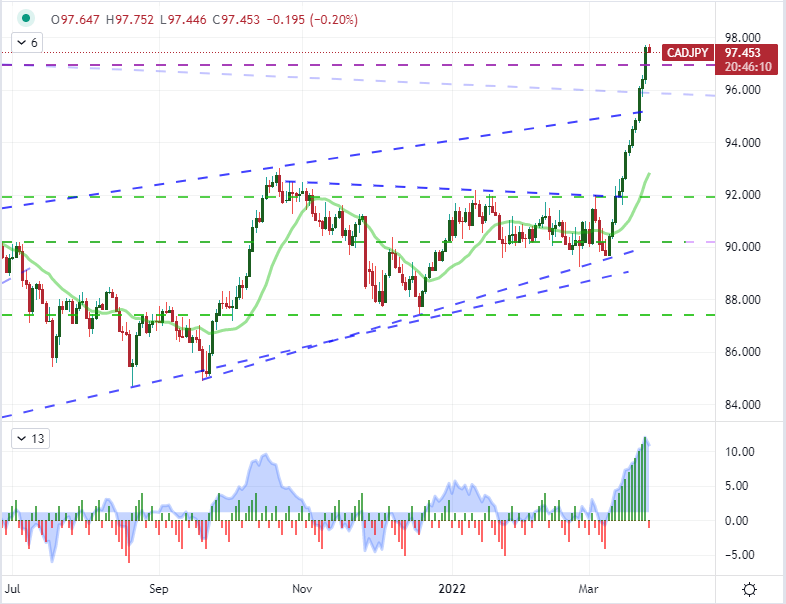
Chart Created on Tradingview Platform
While I do believe that most of the Yen crosses are stretched and subsequently prone to a speculative washout, there is still tangible fundamental backing to the run. I’ll reference USDJPY considering that the Dollar itself has struggled to take advantage of the rise in Fed rate forecasts. Despite that, this pair has a very strong, positive correlation to the US-Japan 2-year government bond yield differential. That looks very much like a carry trade drive, for which many of these pairs have serious backing. Nonetheless, rate forecasts will find an eventual peak and the theme will eventually be discounted in the exchange rate.
Chart of USDJPY with 20-Day SMA Overlaid with US-Japan 2-Year Yield Spread (Daily)
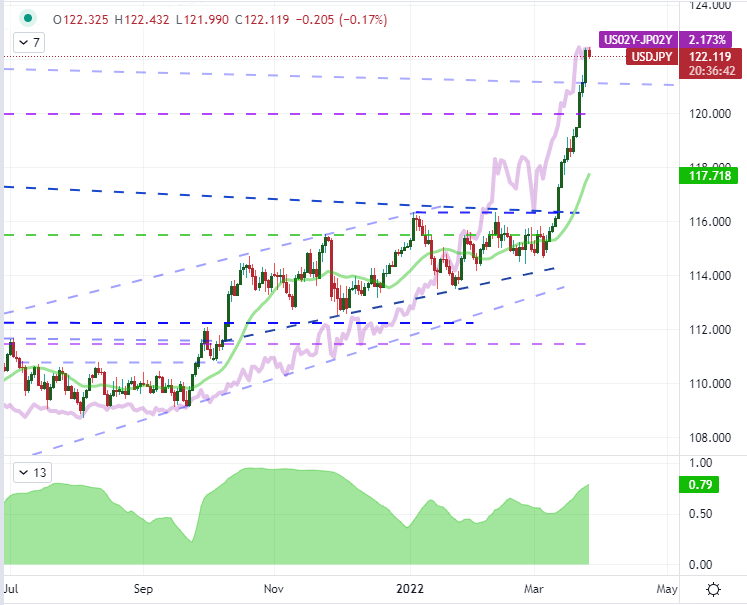
Chart Created on Tradingview Platform


