


SPY S&P 500 ETF, QQQ Nasdaq 100 ETF, EURUSD, GBPUSD and USDCAD Talking Points
- The risk appetite reversal that began in US indices Monday afternoon broadened but slowed this past session with the Nasdaq leading a BTD-style rebound
- Focus on US rate forecasting ebbed this past session on Powell testimony, but it will focus again with the release of the US CPI report
- Among the Dollar crosses with staged technical potential, I prefer the extreme congestion of EURUSD to the active breaks from GBPUSD and USDCAD

The Risk Appetite Rebound Broadens and Cools
We are heading into Wednesday trade with a broader participation in the ‘risk on’ wave, but a throttle to the tempo of the top performing US indices as their speculative exclusivity evaporates. As appealing as the charge may be, remember that the markets are still meaningfully responsive to monetary policy speculation; and the upcoming US session has one of the most important data points for rate forecasting: the monthly CPI release. Before diving into the inflation report, it is important to take the temperature of the capital markets. As I mentioned above, there were far more assets participating in the climb this past session as compared to Monday. In addition to global equities, there were meaningful rallies for the emerging markets (EEM ETF up 2.3 percent) and junk bonds (HYG up 0.5 percent) with some more moderate confirmation from Bitcoin (up 2 percent) and carry trade (NZDJPY rose 35 pips). While there were larger moves on the day, the most impressive in my view was the SPDR S&P 500 ETF advance. The momentum is less important to me than the technical observation of the trend channel floor, which conformed to market conditions more aligned to range and a fundamental break in the monetary policy clouds.

Chart of SPY S&P 500 ETF with 100-Day SMA and Volume and 100-Day Disparity Index (Daily)
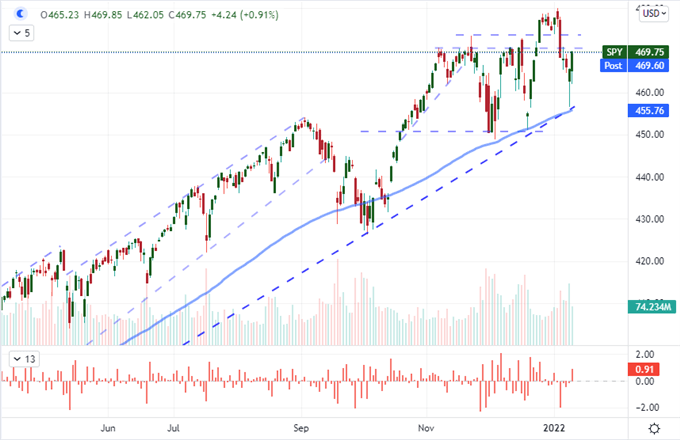
Chart Created on Tradingview Platform
As ‘clean’ as the reversal from the SPY was, the backdrop still does not look like it has shifted meaningfully to support persistent trends. Instead, it looks like the lack of conviction in last week’s downdraft stirred volatility in the short-term reversal. There are a few names for this kind of charge: BTD (buy the dip); FOMO (fear of missing out) and TINA (there is no alternative). These are narrow speculative motivations that spur action in the absence of a more tangible fundamental drive to build up risk exposure. While there wasn’t a particularly impressive rally for the less liquid but more targeted speculative benchmarks from 2021 (eg Dogecoin, meme stocks, SPACs), there was a notable outperformance from the QQQ Nasdaq 100 ETF. The extent of its slide – into a technical breakdown less than two days ago – offered up a more severe discount for the opportunists to jump on. I will be watching the Nasdaq to Dow ratio closely to see how long this speculative squeeze lasts outside of the more virtuous bid.
Chart of QQQ Nasdaq 100 ETF with 100 and 200-Day SMA, Volume and Wicks (Daily)
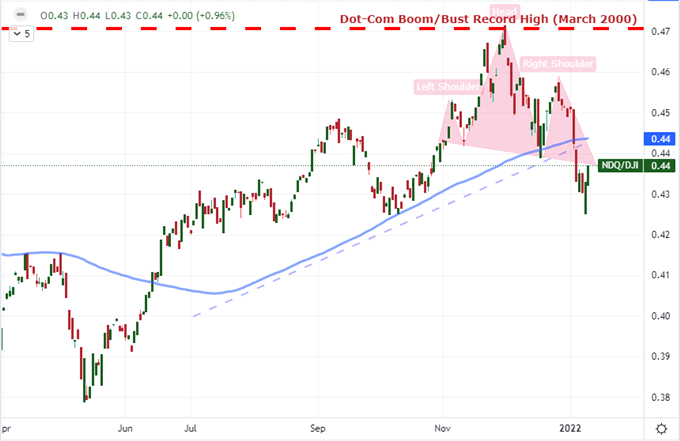
Chart Created on Tradingview Platform
Putting the Markets Back into Fundamental Gear
The focus on monetary policy – and US policy in particular – has not really broken since the year began. Through this past session, the market’s attention shifted to Fed Chairman Jerome Powell’s testimony in his nomination hearing with the Senate Banking Committee. He steered into the hawkish message the group has been more explicitly laying since early December in the lead up to the Dec 16th FOMC decision media blackout period. His comments did speak to a willingness to both hike faster than was officially forecasted and move up the roll off of assets from the balance sheet should conditions warrant. However, there wasn’t much new to change the market’s equation for the current forecast – which has pushed the US 2-year Treasury yield to 0.90 percent and the implied 2022 tightening forecast in Fed Fund futures up to 80 basis points. Further, remarks from some of the more hawkish policy members didn’t do much more than vindicate their previous calls. Ahead, we will take in the US consumer price index (CPI) reading for December. The economist consensus forecast expected headline inflation to accelerate from 6.8 percent to 7.0 percent while core inflation is seen rising from a 4.9 percent pace to 5.4 percent. That will certainly lift probabilities for a near-term hike and possibly four in 2022, but can it really boost the forecast much further?
Economic Calendar of Major Global Event Risk
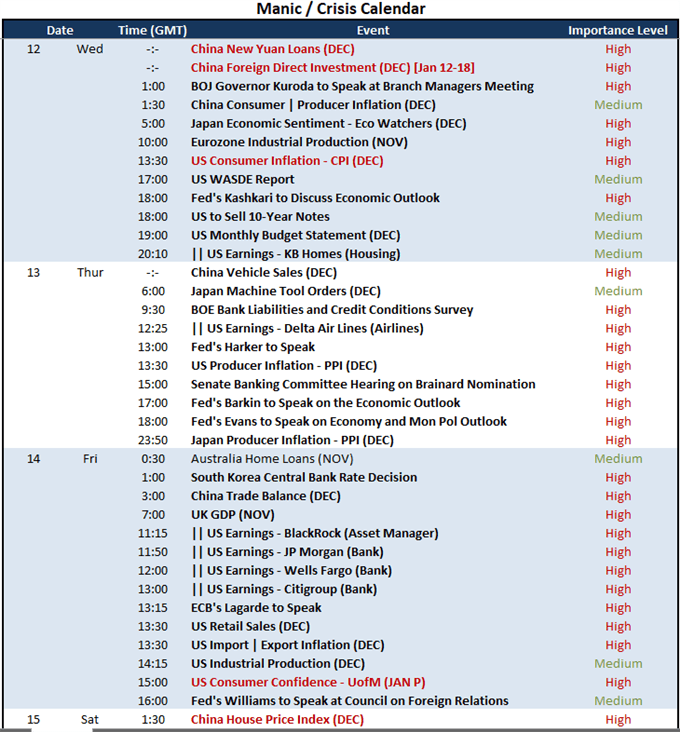
Calendar Made by John Kicklighter
The Dollar Pairs In Wait and Those Already Moving
With monetary policy and risk trends both up for grabs, I will be keeping close tabs on the US Dollar. The Greenback has aligned itself more to sentiment trends over the past month – as higher risk appetite has pushed an appetite for the hawkish yield forecast – but recent activity seems to a possible flip in correlation. USDJPY is still a fundamentally-appealing pair to me as it has multiple scenarios that support a decline…if eventually. But for sheer potential, I think EURUSD edges its counterpart out. We haven’t seen a break either way from this benchmark. In fact, we have had 40 days of a less than 200 point range which represents the smallest band (as a percentage of spot) over that time frame since July 2014 – and before that, there is nothing comparable. These are extremely quiet conditions, and history shows that the last squeeze of this magnitude occurred just before EURUSD tumbled from 1.4000 to 1.0500. At the time, the spark was monetary policy divergence; and we seem to be in similar circumstances now.
Chart of EURUSD with 100-Day SMA and 40-Day Historical Range (Daily)
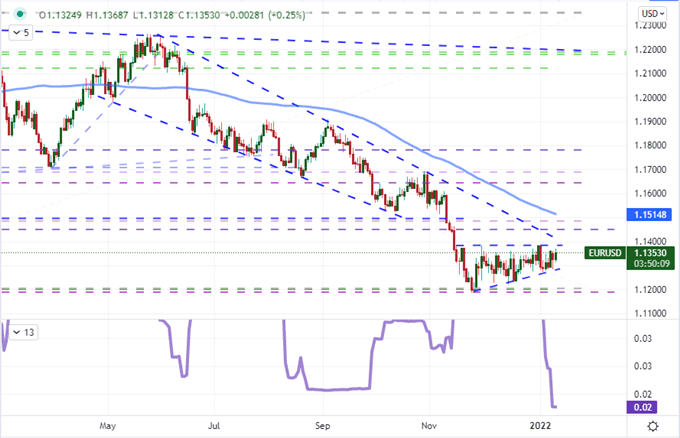
Chart Created on Tradingview Platform
Where EURUSD is a build up waiting for its signal, many traders grow frustrated with the time it takes for such a liquid pair to find resolution. I am a firm believer that patience is a virtue in trading, so I remind myself not to simple chase volatility. If I were so inclined to simply follow all those technical setups that are playing out regardless of the backdrop motivation, the first pair that would come to mind is the Cable. GBPUSD finally broke through its descending channel resistance around 1.3600 this past session. There is potential from this cross in the form of a more distinct monetary policy competition as the BOE has already hiked and there is similarly aggressive rate forecasts behind the UK group looking forward. That said, we need to see how the rate projections for the US play out after CPI.

Chart of GBPUSD with 100-SMA (Daily)
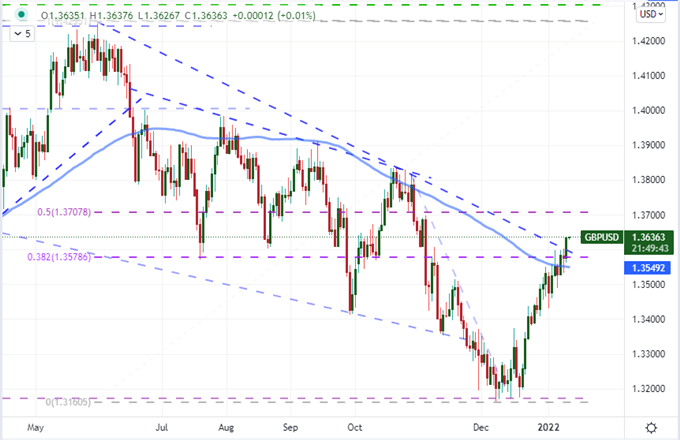
Chart Created on Tradingview Platform
Even less appealing to me is USDCAD. On technicals alone, this pair is offering up a textbook pattern: the head-and-shoulders pattern. This reversal pattern is one of my favorites as its progression is fairly straightforward. That said, breakouts/downs do not guarantee follow through. The drop of 1.2625 cleared the H&S neckline and the 100-day moving average, but what will bears cling to in order to inspire a follow through? The Bank of Canada (BOC) outlook is not nearly as hawkish as the Fed’s currently; and there is little additional data that seems to be connect to this pair specifically. If it does find follow through, it will be through a particular outcome on the US inflation report and subsequent happenstances lining up. I prefer to follow the scenarios with meaningful probabilities.
Chart of USDCAD with 100-Day SMA (Daily)
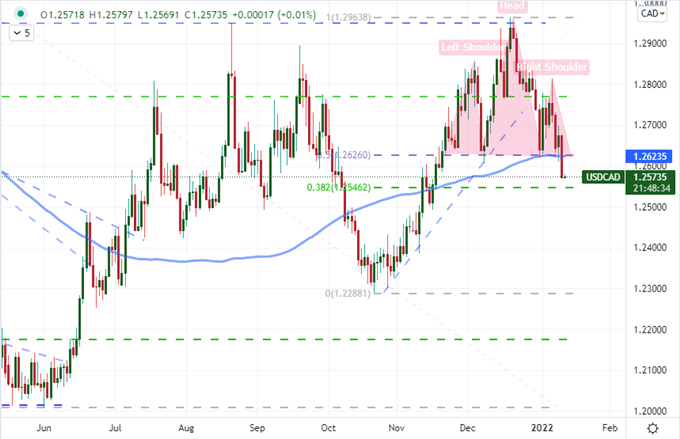
Chart Created on Tradingview Platform


