


SPY S&P 500 ETF, QQQ Nasdaq 100 ETF, Dollar, USDJPY and GBPUSD Talking Points
- The week opened to the momentum of Friday’s selloff for US equities with a QQQ bearish gap through support leading the way
- By Monday’s close / Tuesday’s open, US equities fully reversed course with the SPY S&P 500 ETF posting a technically-clean reversal from channel support
- For market motivation through the coming 24-48 hours, the focus intensifies on US monetary policy with hawkish Fed speakers, Powell testimony and US CPI ahead

A Breakdown Followed by a Familiar ‘Buy the Dip’ Resurgence
If you are unclear as to the speculative bearing for the markets at the beginning of this week, you are not alone. There was certainly a productive level of volatility for benchmark ‘risk assets’, but an abrupt reversal during Monday’s US session keeps conviction on an unclear track. To be sure, this early in the year with liquidity still filling out, it is not that unusual to see market’s unwilling to make a collective commitment. On the other hand, the traction around concerns in a reversal of monetary policy poses the kind of existential threat that could finally knock the US equity market off its bullish trajectory. For now, however, traders rejected the notion that an overdue reversal would be playing out at the beginning of this week. While all of the major US indices would experience a bounce, none were as ‘clean’ in their technical observations as the S&P 500. The broad index was down as much as -2 percent at Monday’s low, but a strong reversal through the day held up the 100-day moving average and channel support back to April 2020. That was quite the ‘buy the dip’ move.

Chart of SPY S&P 500 ETF with 100-Day SMA and Volume and 100-Day Disparity Index (Daily)
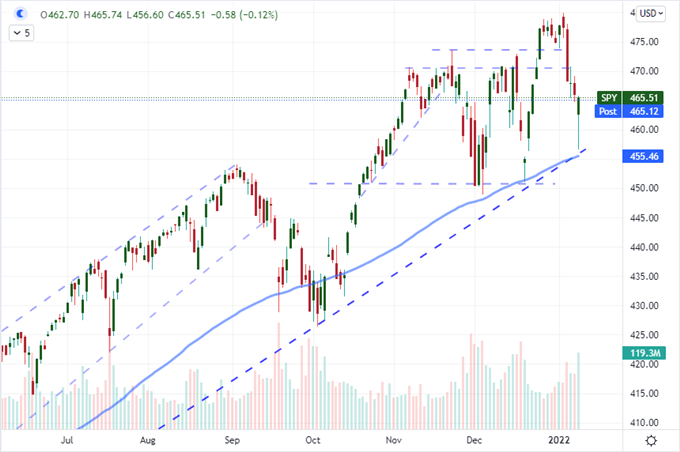
Chart Created on Tradingview Platform
The mix of market participations can significantly change the characteristics of the market. I do believe that what we saw through this past session in US equities was very much a BTD (‘buy the dip’) kind of motivation. Professional managers of capital – banks, managers and traders – don’t put nearly as much weight on the technicals as the retail trader. That said, given how expensive these markets are; there is less enthusiasm to be active for the larger sources of capital which amplifies the shorter-term traders’ day-to-day influence. That amplifies moves like BTD rallies on technical cues. Aside from the S&P 500, the Dow Jones Industrial Average posted the biggest ‘wick’ – 429 points which is the biggest intraday reversal since Sep 21, 2020 – while the QQQs (the Nasdaq 100 ETF) managed to climb out of a ‘hole’. The tech-heavy ETF/index gapped below range support and its channel support to open the week and came very close to hitting a technical correction (-10 percent from the all-time high), but it enjoyed the recovery momentum. Question now is whether this is a full false break reversal…meaning: does it have momentum?
Chart of QQQ Nasdaq 100 ETF with 100 and 200-Day SMA, Volume and Wicks (Daily)
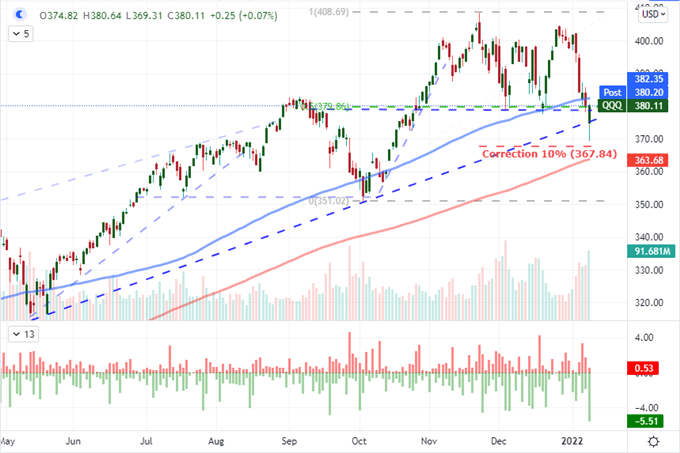
Chart Created on Tradingview Platform
The Fundamental Fuel for Follow Through in Either Direction
While technical cues are very helpful in taking the temperature of the market – particularly when gauging the correlation across asset types – the fundamental focus is an important consideration for me when evaluating what will carry the market to a genuine trend. There were a few fundamental matters through Monday including Eurozone employment and meme stock earnings (ie Tilray), but neither of those was systemic. Top listing on my calendar for potential impact was the New York Fed’s consumer inflation expectations report for December. Given the attention and volatility paid to the FOMC minutes and other policy adjustment updates from the US yesterday, this lead in for Wednesday’s CPI was a must watch. The 1 and 3-year inflation forecasts held unchanged (6 and 4 percent respectively) which keeps the pressure on Fed rate forecasts. These implied yield from Fed Fund futures in 2022 has edged up to 80 basis points with a first hike in March hovering at 75 percent.
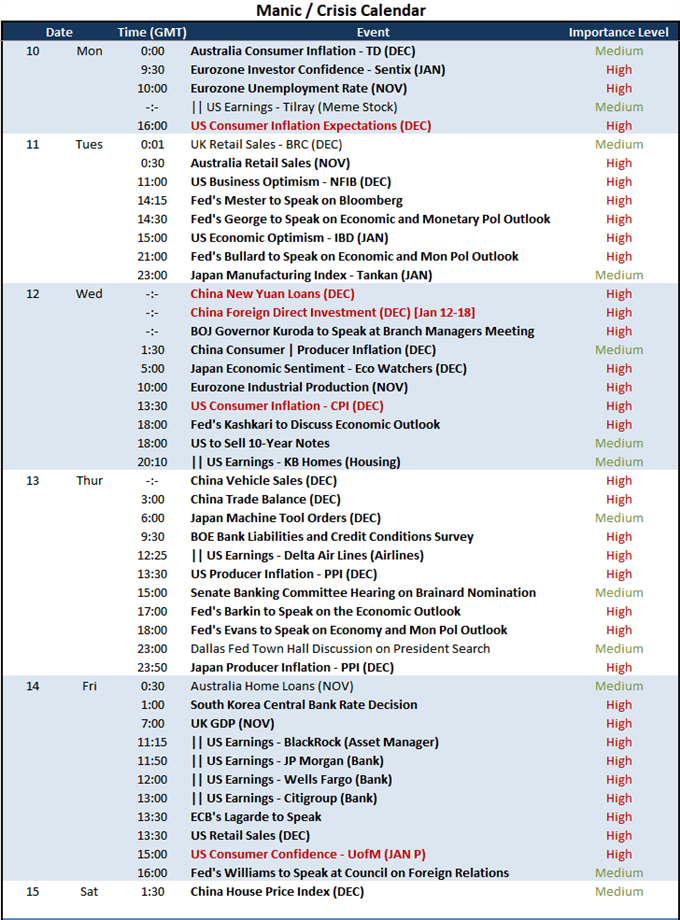
Economic Calendar of Major Global Event Risk
Calendar Made by John Kicklighter
Looking ahead for further Fed policy speculation cues, we have a pretty steady diet of fundamental developments to digest. While the market’s favorite US consumer inflation report is scheduled for release on Wednesday, there is an important interlude to consider through today’s session. On tap, we have Fed Chairman Jerome Powell testifying at his nomination hearing before the Senate Banking Committee. He will certainly be grilled amid high inflation, covid concerns and market volatility; but he is pretty capable at keeping to the group line. On the other hand, the run of hawkish Fed officials’ commentary due from Cleveland Fed President Mester; Kansas City Fed President George and St Louis Fed President Bullard represents insight from the most hawkish policy members of the past few years. That is made even more interesting consider two of the most vocal doves (San Francisco’s Daly and Minneapolis’s Kashkari) made explicitly hawkish remarks last week.
Table of Federal Open Market Committee Members and Policy Standing
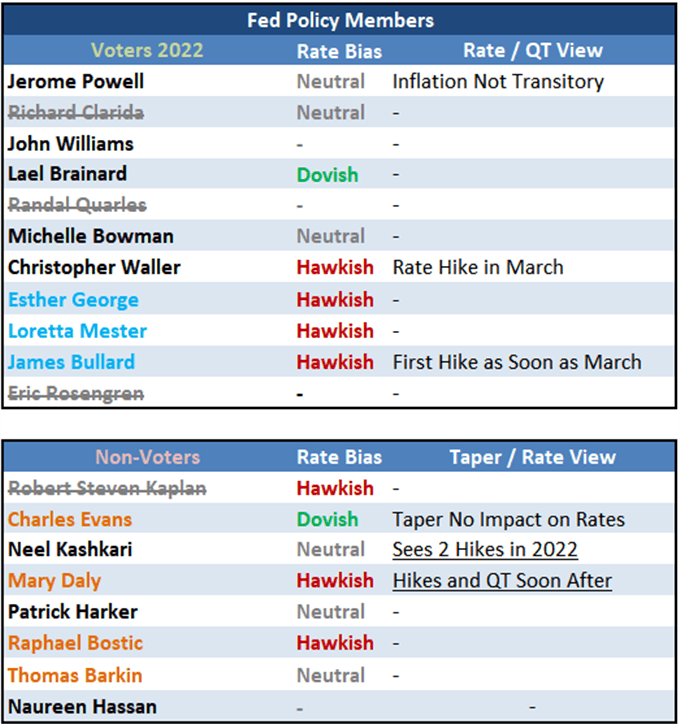
Table Made by John Kicklighter
The Dollar is Due a Break But Scenarios Don’t Always Play Out Cleanly
There is a lot to draw as opportunity across the financial market given the state of risk trends and the focus on monetary policy (US and global), but I believe the Dollar holds disproportionate potential. Looking to the DXY trade-weighted Dollar’s 7-week range (35 trading days), we are in rarified condition whereby the benchmark currency is traversing an extremely narrow trading band. A break is inevitable, but it doesn’t mean it has to happen imminently. We can stretch out this tension for days or perhaps even weeks, which will only make the pressure that much greater. The prevailing trend is bullish with Treasury yields supporting the bearing, but I believe the market’s have overindulged in hawkish forecasts and a break lower would be technically easier to traverse. Preferences are important for strategy analysis, but let the market’s ultimately decide its mind before placing trades.
Chart of DXY Dollar Index Overlaid with 20-Week SMA and 5-Week Historical Range (Daily)
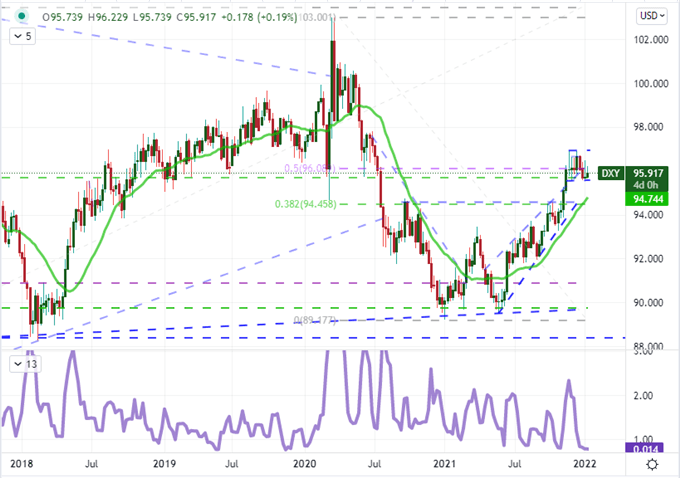
Chart Created on Tradingview Platform
In assessing the candidates for some Dollar activity, my preference remains with USDJPY. This pair has two fundamentally related drivers to consider. On the one hand we have the risk trends that all Yen crosses tend to follow – and I should point out that there wasn’t nearly the recovery from carry trade as there was with the US indices through the second half of the New York session. We also have the carry trade sensitive to US interest rates. Should the ‘four rate hike and quick QT’ forecast flag for the Fed, that is a bearish motivator for the Greenback. Interestingly, should interest rate expectations climb too high, it is likely to trip risk aversion which makes for something of a backup bearish trip wire on these pair. W have already clear support last week and now I’m watching to see if former support at 115.60/50 stands as new resistance.

Chart of USDJPY with 50-SMA, Emini S&P 500 Futures and 20-Period Correlation (4-Hour)
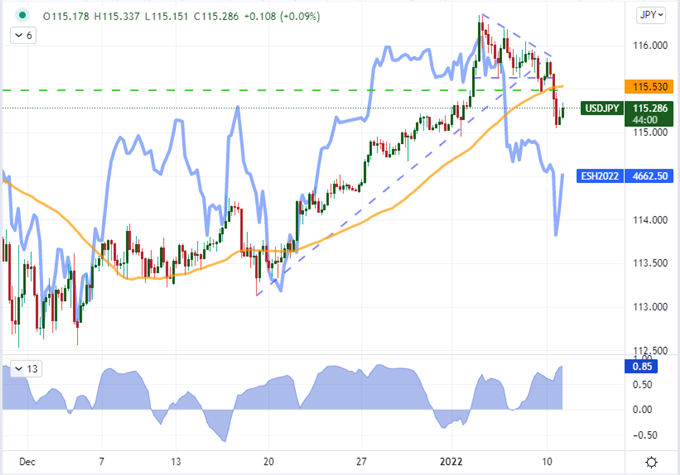
Chart Created on Tradingview Platform
Another pair of interest for the sense of imminent technical resolution is GBPUSD. ‘Cable’ has built pressure into the top of its descending trend channel stretching back to this past May. The 1.3600 level holds overlapping technical influence and is probably on the radar of more than just the chart watchers. There isn’t much in the way of top UK event risk through the upcoming session, so I believer relative monetary policy views will play a considerable role here. While we consider the Fed to be hawkish, the BOE has remarkably kept pace – some would even say outpaced its US counterpart. There is potential for a break in either direction, but a bearish resolution would be more fitting technically while a bullish one would cater to a peak in US rate projections.

Chart of GBPUSD with 20-Day SMA, UK-US 2 Year Yield Differential and 20-Day Correlation (Daily)
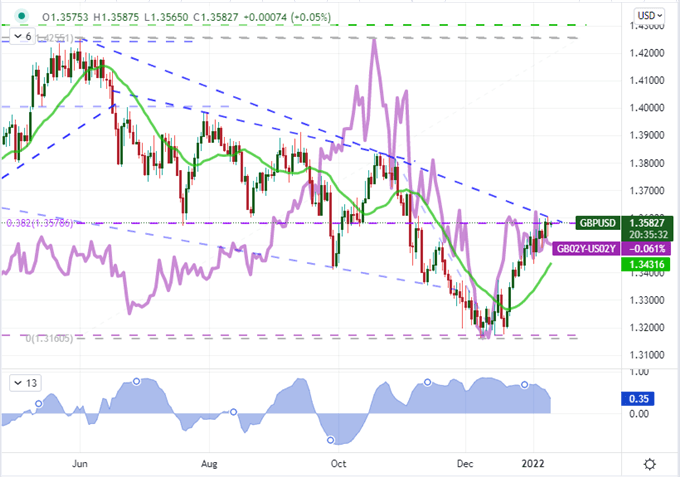
Chart Created on Tradingview Platform


