S&P 500, Dow, China, USDBRL, AUDCAD and Dollar Talking Points
- The rally that stretched beyond the S&P 500 to encompass the broader risk markets through the first 48 hours of the week decelerated rapidly as highs came back into view
- Scheduled event risk is thin over the coming 24 hours while the probable abstract themes have increasingly prominent negative risk potential – such as China
- Monetary policy remains a productive theme after three rate decisions this past session, but anticipation for the Fed decision next week may work against trends


A Sharp Deceleration in Risk Trends
The impressive rally from risk assets like the S&P 500 through the first two trading days of the week stalled out this past session. For those tracking the US indices, this loss of traction either seems very appropriate or incredibly frustrating. The S&P 500’s sudden shift in gears can be seen in the below ratio of the 1-day to 5-day ATR (‘average true range’ volatility measures) and has cast us uncomfortably adrift just shy of the record 4,705 close on November 18th and the intraday high of 4,683 on November 22nd. Notably, the Nasdaq 100 is further from its own highs and is instead at the previous ‘shoulder line’ range around 16,450 and the Dow is furthest from its high amongst its cousins (-2.3 percent). The same lack of progress can be found in other sentiment measures I track including global equities, emerging market assets, junk bonds and carry trade.
| Change in | Longs | Shorts | OI |
| Daily | 1% | -1% | 0% |
| Weekly | 15% | -13% | -1% |
Chart S&P 500 with 100-Day SMAs with 5-Day ATR and Ratio of 1-Day to 5-Day ATR (Daily)
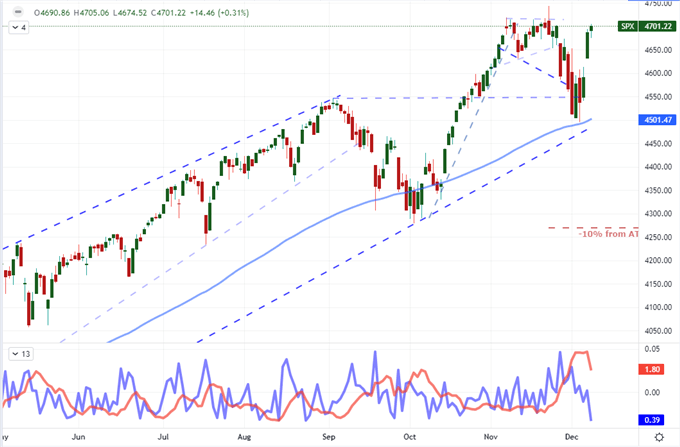
Chart Created on Tradingview Platform
The tempo change from the sharp bull trend to treading water suits seasonal conditions whereby liquidity and volatility tend to throttle down through the month of December. Perhaps more active a braking though is the anticipation associated the last major scheduled event through the end of the year: next Wednesday’s FOMC rate decision. To keep a trend running – bullish or bearish – I believe there needs to be fundamental fuel to keep the fires going. Those probable opportunities to further charge bullish interests seem to have played out or are otherwise fading to the backdrop. For example, the recent advance seems a relief rally in part associated to reports that the omicron variant may not be as deadly as feared while the passage of legislation to prevent a US default scenario next week (December 15th) has been the running expectation throughout.
On the other hand, there are lingering issues that could trigger sudden trouble for risk markets. In particular, China’s struggle with Evergrande and the default pressure of major property developers represents a potentially severe risk while data around the situation remains opaque at best and attention has evaporated. Not only are headlines fewer and farther between, but benchmarks like the Shanghai Composite advanced and the Chinese Yuan hit three-and-a-half year highs (USDCNH lows).
Chart of USDCNH (Daily)
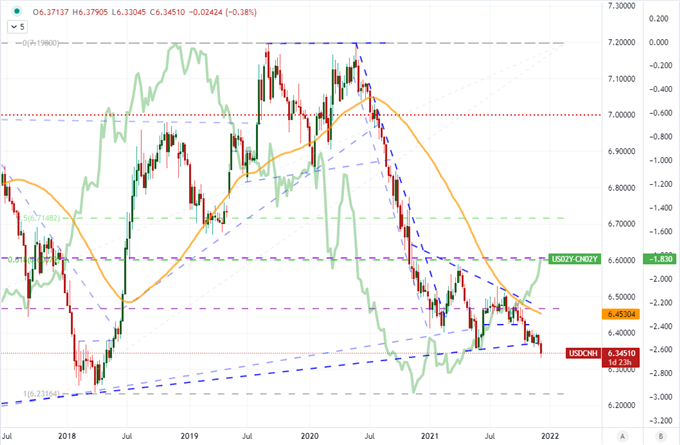
Chart Created on Tradingview Platform
Central Bank Actions Generate Unexpected Activity
There were three major central bank rate decisions this past session. The most remarkable of these policy updates would come from the Brazilian policy authority which announced a 150 basis point hike to 9.25 percent. That is a serious upgrade on the benchmark and truly bolsters its appeal as a carry currency, yet the response from the Real didn’t seem to acknowledge the swell. While USDBRL did post an impressive -1.4 percent drop through the session – only the biggest single-day drop in four weeks – the bulk of the movement occurred before the actual policy announcement. Why the disconnect? The market had largely expected the move from this already hawkish group. Notably, the BCB has tightened up its policy multiple times this year as the currency has generally declined (USDBRL risen). Though the income associated with the currency has grown, the perceived risk around the economy and its assets has outstripped the appeal.
Chart of USDBRL (Daily)
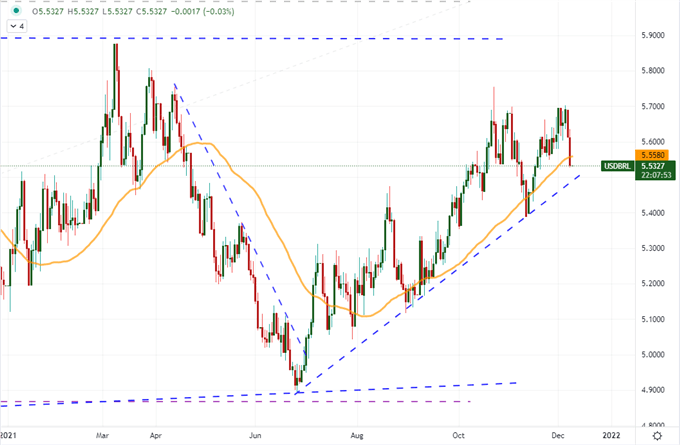
Chart Created on Tradingview Platform
Putting aside the Reserve Bank of India (RBI) policy and forecast hold, the Bank of Canada (BOC) decision proved the most market-moving of the three updates. Here, we witnessed the exact opposite scenario to the BCB and Real response. The Canadian central bank held its benchmark unchanged at 0.25 percent and its forward guidance insinuating a first rate hike around late Q1 or early Q2. There isn’t much change in this outcome, but the market had built up a seriously hawkish forecast through Canadian rates and the Loonie over previous months. Therefore, status quo doesn’t exactly support the stretch bulls had put in. The Canadian 2-year yield dropped 7 basis points (-5.8%) from a 21-month high. In turn, the Loonie pulled back. Of course for pairs like USDCAD and CADJPY where there were cross fundamental influences, the impact was muted. But for AUDCAD where the RBA response was moderately bullish, the impact was amplified.
Chart of AUDCAD Overlaid with AU-CA 2-Year Yield Spread, 20-Day Correl and 1-Day ROC (Daily)

Chart Created on Tradingview Platform
Potent Dollar Reversal Potential but a Dearth of Motivation
Though there is a steady strum of interest around US monetary policy, growth and capital market health; the US Dollar hasn’t generated much in the way of traction. In a twist, the Greenback’s shift into the role of a carry currency of late has seen the currency struggle for direction against its typical safe haven moorings. This past session, the US 2-year yield (as a proxy for Fed rate forecasting) eased back modestly from a its pre-pandemic high, but only modestly. Nevertheless, the Dollar posted its most definitive move of the month thus far in a technical break lower in an already permeable wedge. The slide does not yet translate into a meaningful reversal for EURUSD, but there are some other pairs that stand on the verge of capitalizing on a USD bearish reversal such as GBPUSD, AUDUSD and USDCAD. With the FOMC decision on the 15th and US CPI this Friday, potential may remain just that until the catalysts hit.
Chart of DXY with 50-Day Moving Average Overlaid by 2-Year Treasury Yield (Daily)
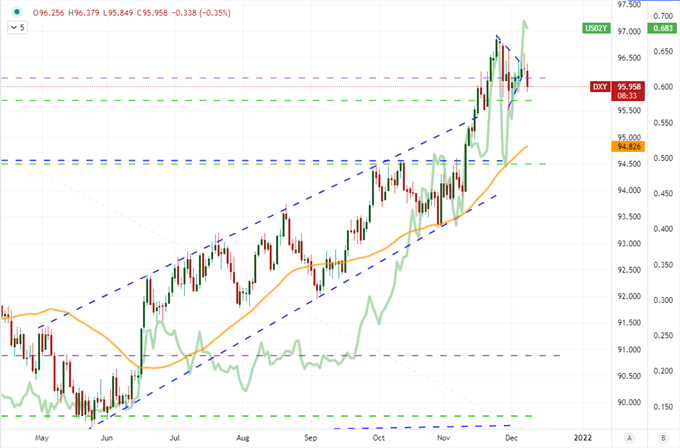
Chart Created on Tradingview Platform


