


Nasdaq 100, S&P 500, VIX, USDJPY and AUDCAD Talking Points
- Risk assets suffered a relentless back and forth this past week with the S&P 500 on the verge of a bigger collapse while the Nasdaq 100 leaned into an H&S reversal
- Throughout the manic movement of the US indices, the relentless drive of volatility represents the greater risk with the power to override seasonal assumptions for December
- Fed rate expectations have held firm through the market’s underlying volatility with US CPI a beacon for event risk alongside the BOC and RBA rate decisions

Risk Aversion Is Precariously Close to a Troubling Turn
At the end of the past week, the major US equity indices – the Dow, S&P 500 and Nasdaq 100 – would hold above the critical turning points in their over-riding bull trends and their respective ‘technical corrections’ (-10 percent pull back from all time highs). Yet, that was cold comfort for those keeping tabs on the weeks-long erosion in broader risk trends and the very obvious charge in volatility that carried into the weekend. In general, volatile markets are foundation for serious financial market problems. Since the pandemic – and arguably back to the turn after the Great Financial Crisis – there has been a material reliance on market appreciation based on unchallenged momentum. With an elevated market tempo, the chances of taking out a critical technical support and/or metabolizing a latent fundamental fear is troublingly high. Though headlines related to the Omicron spread or the panic around monetary policy normalizing will be lines to track, I like the tangible milestones on the charts. The peak speculative benchmark of the past year, the Nasdaq 100 confirmed its head-and shoulders neckline break this past week, but the true line in the sand in the week ahead is 15,000.
Chart of Nasdaq 100 with 50 and 200-Day SMAs (Daily)
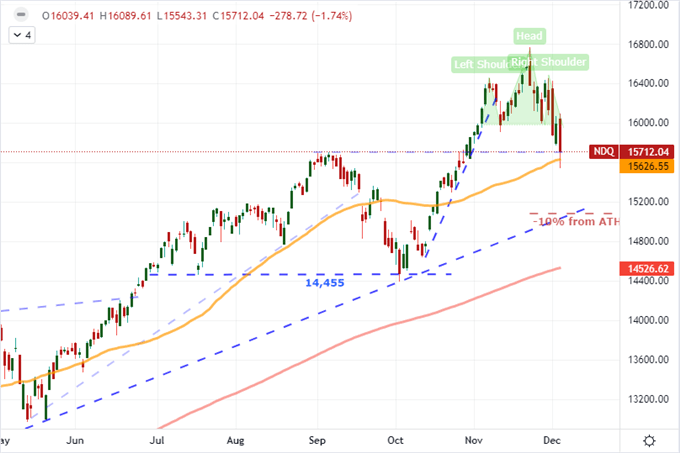
Chart Created on Tradingview Platform
The Down and S&P 500 may not have been as committed into the close of this past week, but they are much closer to their make-or-break support levels. The S&P 500 has the confluence of the post-pandemic channel floor and 100-day moving average just below 4,500. What makes this benchmark even more interesting is its role in deriving the most closely watched ‘fear’ indicator, the VIX. The volatility index surged above 30 this past week and ended above the 10-month threshold through Friday. That is a particularly worrying level for those that expect a typical reversion to the December quiet with the commensurate risk-positive drift. While the SPX, NDX and DJIA support levels are ‘important watch’ considerations in the week ahead; the ATR readings (realized volatility) and VIX index are my top concerns.
{{ SENTIMENT|US500}}
Chart S&P 500 with 200 and 100-Day SMAs, 5-Day ATR, 5-Day Range and Inverted VIX (Daily)
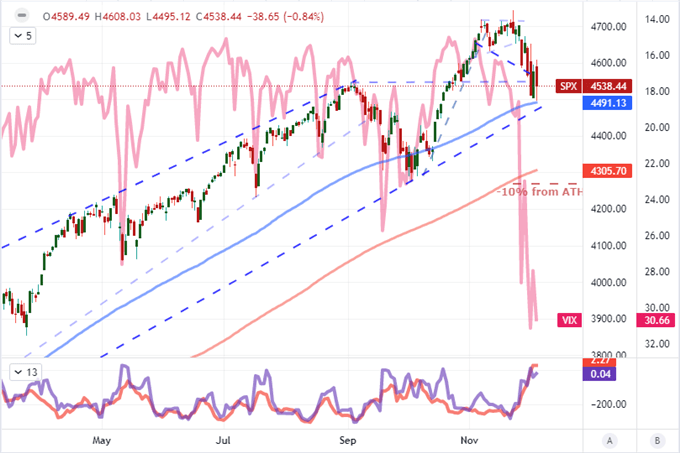
Chart Created on Tradingview Platform
Seasonality is Not a Certainty
In the 49th week of the trading year, the S&P 500 typically registers a modest gain while the VIX volatility index continues a slide that peaks in 8 weeks prior. Clearly, we are not living up to either of those more granular seasonality figures, which calls into question the capacity for a comfortable slide into a stable and buoyant December. I still believe this historical seasonal norm is the most probable course moving forward, but history shows certain and sometimes disruptive divergences from that mean. If volatility remains loaded, the run of thematic troubles plaguing investors’ dreams could prove fertile ground for active deleveraging. I maintain that it wouldn’t take an overbearing speculative drive to tip the markets into a heavy tumble, rather it likely to take simply by tripping over the excessive leverage in the financial system.
Chart of S&P 500 Monthly Performance, Volume and Volatility
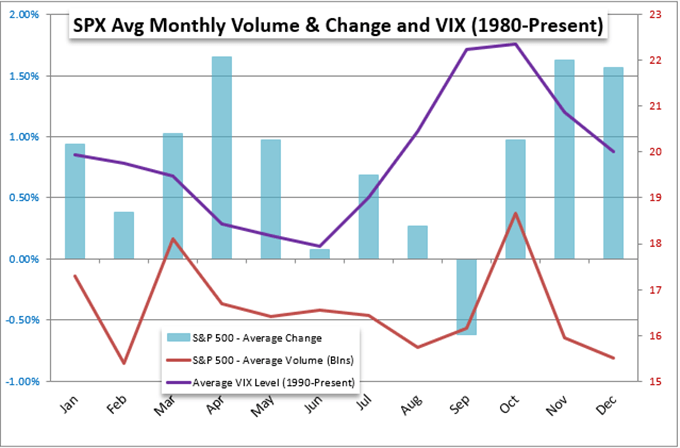
Chart Created on John Kicklighter with Data from Bloomberg
Among the Systemic Themes to Watch this Week: Monetary Policy Tops the List
Looking ahead to the coming trading week, I believe the most disruptive themes of the previous period will represent the greatest disruption to the financial system. While the US government seems to have pushed back the deadline for running out of funds and risking a financial catastrophe, the spread of the most recent variant of the coronavirus (Omicron) is still a wide open threat. This has natural implications for growth concerns, with the IMF stating at the end of the past week that forecasts may be need to be lowered owing to the uncertain influences this health risk holds for the economy. That said, the same group has also suggested the Fed should hasten its response to inflation pressures – a call echoed by strong employment and service sector activity reports this past Friday. I do think the FOMC will accelerate its previously stated taper and rate time tables, but we won’t see anything tangible on that front until the next rate decision on December 15th. That opens the door to rate speculation which is already ebullient as well as risk aversion that would further tame those expectations. On this front, USDJPY is an interesting candidate – though somewhat complicated. I’ll be watching 112.50 very closely this week.
Chart of USDJPY Overlaid with US to Japan 2-Year Yield Differential (Daily)
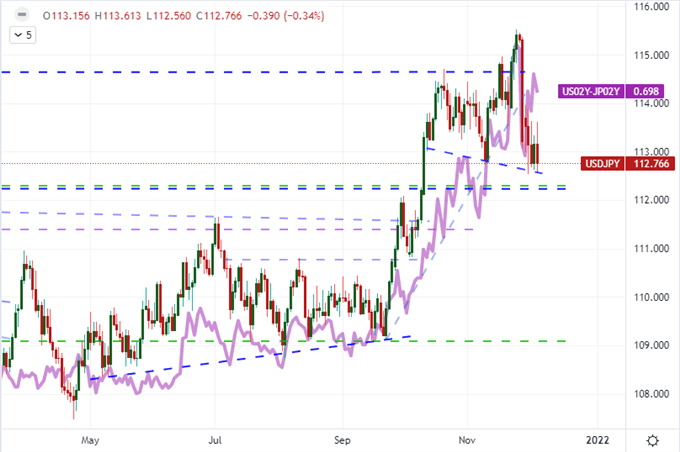
Chart Created on Tradingview Platform
Amid the scheduled event risk, the US CPI update for November will be particularly interesting given the Fed’s decision in the following week. That said, the market’s favorite inflation indicator doesn’t cross the wires until Friday. That makes the report more capable of distracting us from volatility in anticipation rather than generate movement in the short time before the New York release and weekend liquidity drain. If you are looking for more potent monetary policy influence, consider the Reserve Bank of Australia (RBA) and Bank of Canada (BOC) rate decisions on tap ahead. The RBA took a dovish tack at its previous policy update, which added to the Aussie Dollar’s bearish pressure. A bigger market impact would follow a hawkish shift. Alternatively, the Canadian central bank ended its stimulus program recently, so it is still coasting towards the vaunted rate hike. That said, the aggressive 12-month rate forecasts built up in previous weeks has notably deflated. This is more of a candidate for either a bullish or bearish surprise. If you want to see the greatest focus of volatility risk, watch AUDCAD.
Calendar of AUDCAD with 200-Day Moving Average and 1-Day Rate of Change (Daily)
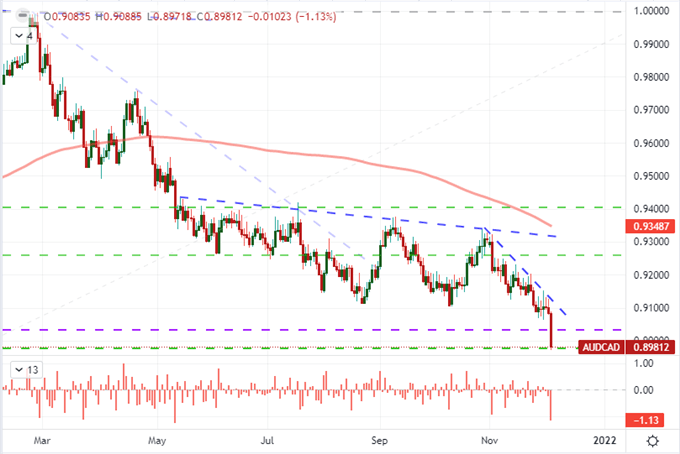
Chart Created on Tradingview Platform


