


S&P 500, Nasdaq 100, Emerging Markets, Alibaba, EURUSD and USDTRY Talking Points
- The S&P 500 and Nasdaq 100 closed at record highs this past session, but the lack of participation in most other risk-leaning assets suggests this was not a ‘risk’ move
- Earnings is winding down, but the disappointment from Walmart earlier this week is still far less intense than Alibaba’s performance – a statement for USDCNH
- US rate forecasts are leveling out which has curbed the Dollar’s rally; meanwhile, the Turkish central bank’s aggressive rate cuts may tip into a currency crisis

The S&P 500’s Record High Doesn’t Peak Bullish Conviction
This past session’s close was a record high for the S&P 500. The benchmark US equity index ended the day just shy of 4,705 which is a record close for the index. If the diehard bulls had any shudder to their conviction, the Nasdaq 100 joined the broader index with its own unprecedented threshold. Yet, what the benchmark US indices reflected was far from the mood in the broader financial system. The fundamental concerns around inflation, monetary policy shifting and a plateau in growth aside; there were more overt technical disconnects with a notable divergence from the Dow and wider berth relative to other risk assets. For the SPX itself, the chart doesn’t even register as a technical break. While the close was technically the highest on record (the 66th such record this year, which is the highest tally since 1995), the chart doesn’t look like a breakout at all. On a candlestick chart, it looks like we continue to carve out a terminal wedge that will indeed require a break – even if out of necessity – soon.
| Change in | Longs | Shorts | OI |
| Daily | 1% | -1% | 0% |
| Weekly | 15% | -13% | -1% |
Chart of S&P 500 with 20-Day SMA, 10-Day Historical Range and Daily Wicks (Daily)
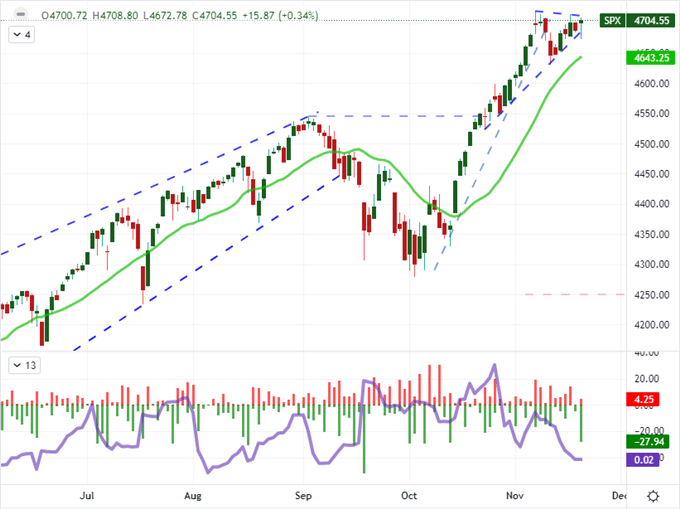
Chart Created on Tradingview Platform
The first line of contrast that highlights that something is amiss in sentient can be visualized in one of my favorite ratios of late: the Nasdaq 100 relative to the Dow Jones Industrial Average. The comparison of ‘growth’ to ‘value’ within the US equities market charged to a record high through Thursday. Sentiment is a universal, so a robust backdrop would be a rising tide that should lift all boats. That said, there is more than just an intensified preference for top performers. There is isolated performance. An absence of a broad-based bid continues to drive traders to seek out momentum rather than the perception of value which creates a FOMO (fear of missing out) like mentality in preference.
Chart of Nasdaq 100 to Dow Jones Industrial Average Ratio and 20-Day SMA (Daily)
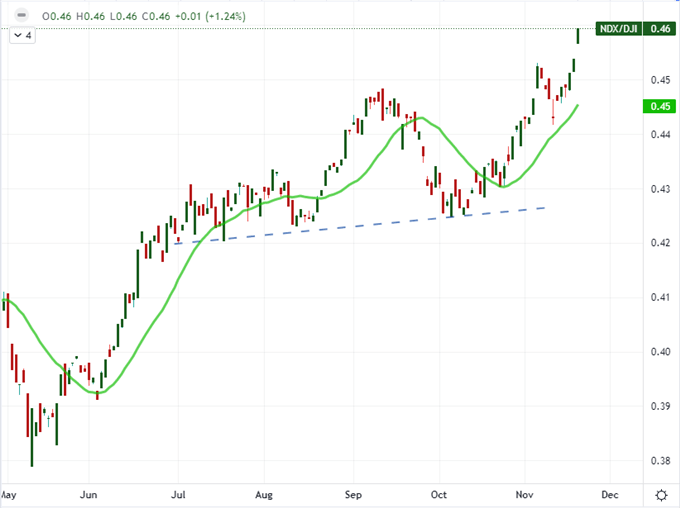
Chart Created on Tradingview Platform
Looking even more broadly, we can see in the past month that there is a very distinct appetite for risk appetite in US equities in particular. In a month-over-month performance assessment, we find that US indices are the only baseline measure actually in the green – the S&P 500 is up 5 percent. In contrast, the ‘rest of world’ equity ETF, the VEU, is virtually unchanged over the same period. Junk bonds (HYG) and emerging market capital assets (EEM) are under water as inflation continues to front-run interest rate expectations in the developed world. Even carry trade where yield differential potential would seemingly rouse some conviction and appetite has faded. USDJPY would even relent off its drive to multi-year highs in sympathy to other Yen crosses.
Chart of One-Month Rolling Performance of S&P 500, VEU, HYG, EEM and AUDJPY (8-Hour)
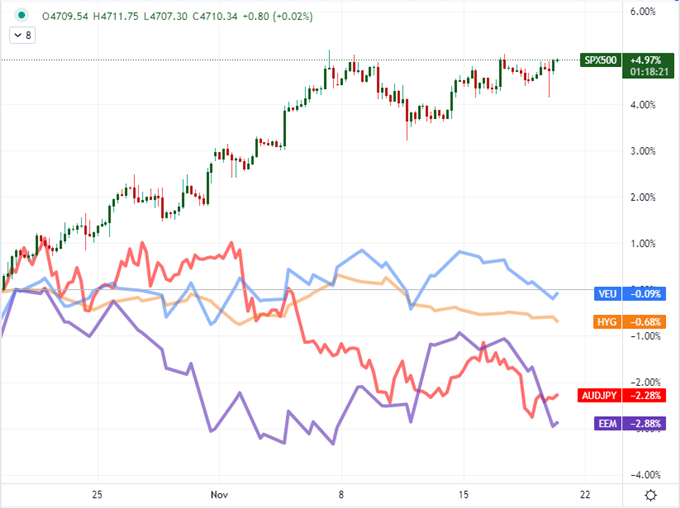
Chart Created on Tradingview Platform
The Fundamental Sparks Continue to Fly
If we finally find a definitive S&P 500 break in the immediate future (Friday or Monday is highly likely), expect to see the fundamental explanations to chase the move. A systemically-catalyzed move would best be ideal from the fundamental trader’s perspective, but markets have been far too aloof on such matters for me to expect this to be the course moving forward. Instead, I believe a sentiment-born move will lead to a technical resolution and then fundamentals to come in to justify the resolution. On tap through the final trading day of the week, we have growth-related headlines to digest. On the systemic side, we have White House’s stimulus program under review; while both the UK and Canada will issue retail sales. I believe the central bank speak and US options expiration will carry greater weight ultimately.
Calendar of Major Macro Event Risk Friday and Early Next Week
Calendar Created by John Kicklighter
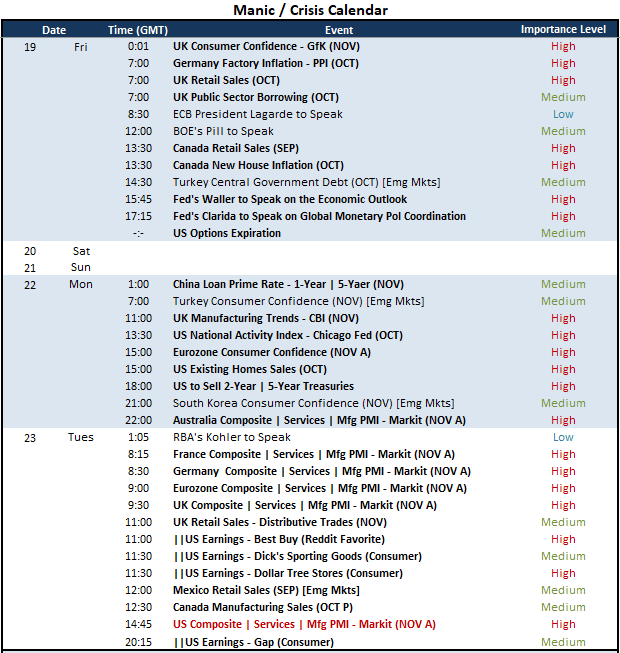
While we are evaluating data points, I think it is important to keep tabs on more abstract matters as well. The worry over China’s economic and financial health has ebbed as the news from the country has tapered – probably by design. However, we were reminded by rating agency Standard & Poor’s this past session that troubled Chinese property developer Evergrande was still likely to default. It is difficult to calculate how significant an event this will be for the global system. Meanwhile, earnings offered an unexpected (but important) view of Chinese market performance. While USDCNH and the Shanghai Composite have held remarkably steady, the earnings from Alibaba disappointed significantly. BABA shares dropped sharply on the news, exacerbating the contrast between the Chinese e-commerce company’s performance relative to US-based Walmart. If you look at a ratio of WMT to BABA over the years, the correlation to USDCNH was remarkably strong until the past 18 months. Which measure is more indicative?
Chart of USDCNH with 50-Week SMA Overlaid with Walmart-Alibaba Ratio and 20-Week Correl (Weekly)
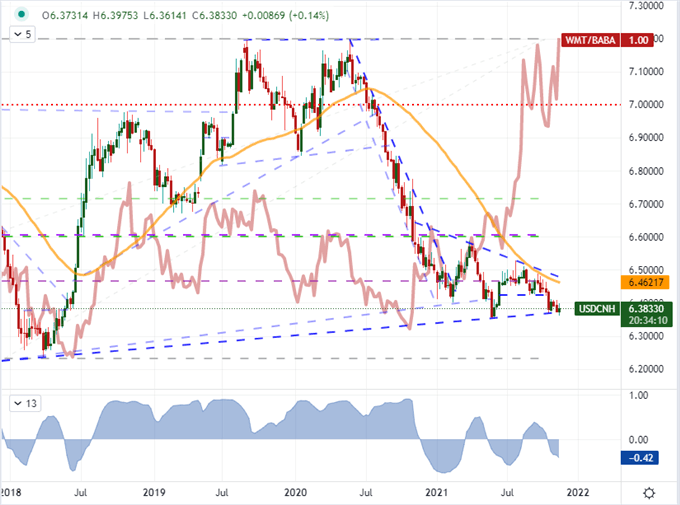
Chart Created on Tradingview Platform
Monetary Policy Remains an Undercurrent and Willing Leader
While speculative bias is the most productive driver for the time being, there is a lurking fundamental influence in the monetary policy arena. The Dollar has been the most productive driver in the past few weeks, but its drive hit the skids over the past 36 hours. Inflation and interest rate measures for the US leveled out recently which has cut the Greenback’s growing relative advantage. This led to the USDJPY’s pullback from its 114.50 break, but it has also spurred a sharp rebound from EURUSD. After Wednesday’s dramatic intraday reversal posted the largest ‘lower wick’ in six months, we say further rebound from the pair. The German-US 2-year yield differential hasn’t tuned as abruptly, but expect that to be an import follow up.
Chart of EURUSD with 100-Day SMA and Daily Wicks Overlaid with German-US 2-Year Yield (Daily)
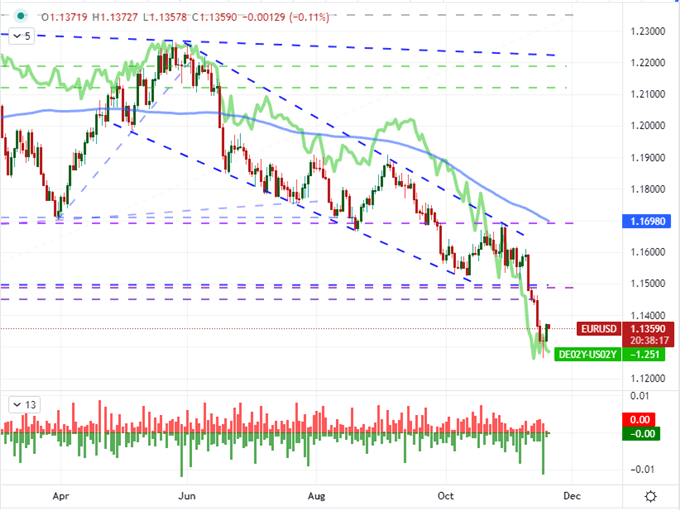
Chart Created on Tradingview Platform
Outside of the core monetary policy trends across the globe, this past session has exposed the secondary effects that the emerging market has had to struggle through. The South African Central Bank (SARB) followed through on the expected 25 basis point rate hike to 3.75 percent that was priced in, but the market was not at all surprised. The higher yield in fact didn’t even prevent USDZAR from breaking higher and in turn clearing the ‘neckline’ on an inverse head-and-shoulders pattern. The more incredible story was around the Turkish Central Bank (CBRT) which cut rates an aggressive 100 basis point to 15 percent. The rate cuts defy Western monetary policy convention of combating heavy inflation and in turn undermine the central bank’s credibility. This is pushing the country to the point of possibly risking a currency crisis.
Chart of USDTRY with 50-Day SMA and 3-Day Rate of Change (Daily)
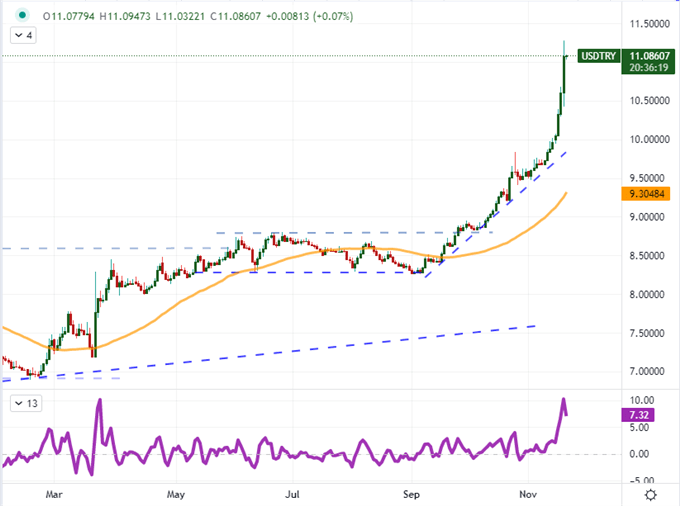
Chart Created on Tradingview Platform


