


Nasdaq 100, S&P 500, Dollar, EURUSD, USDJPY and USDMXN Talking Points
- The S&P 500 extended its rally to a 7th consecutive session, but the Nasdaq 100’s 10th straight daily rally really earns the headlines
- Speculative appetite is proving more and more concentrated in particular channels but that doesn’t mean the bullish bias has to come to an end
- Key fundamental themes will offer less competition for our attention next week, but traders should be on alert with record high cost-of-entry and plenty of potential for surprises

A Concentrated Risk Appetite
If I had to evaluate the health of risk appetite this past week, it would be an evaluation of a mixed backdrop. That is important for those looking to navigate the markets with a generalized confidence in all measures of speculative appetite or otherwise confident that a persistent wind will remain to the bulls backs. Looking across a broad array of ‘risk’ assets, there remains a varying degree of speeds and an uninspiring rate of return to solidify the backdrop which can weather rough fundamental seas. A closer look shows that there is a more targeted appetite among risk seekers. US indices are leading the buoyancy with an incredible consistence. The S&P 500 registered a rally over 7 consecutive sessions, but the Nasdaq 100 outstrips that performance with its own 10-day climb. These are incredible stats, but they should not be considered reversal risks as previously such instances have not triggered full reversals. That said, a statistical set back is increasingly likely.
Chart of Nasdaq 100 with 20 and 200-Day SMAs, Consecutive Candles (Daily)
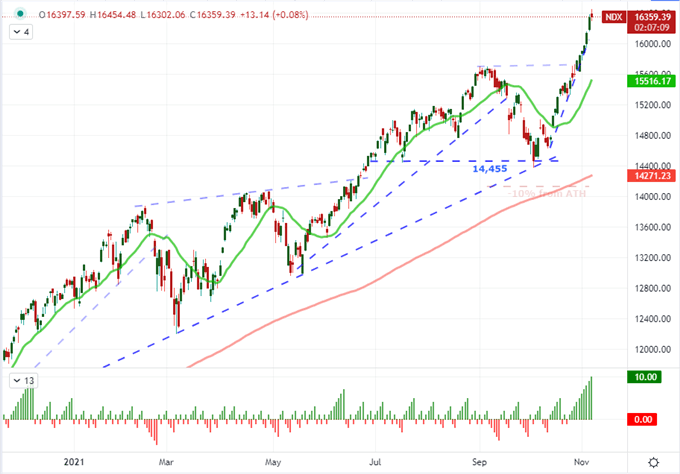
Chart Created on Tradingview Platform
Taking a closer look at the appetites of the speculative hordes, there is a distinct preference for were capital is being funneled. There was a notable jump in junk bonds this past week, but that seems to be tied to a curb in the most aggressive interest rate expectations of the past months. Emerging market assets are flat, carry trades have actually slipped and even global equities are noticeably lagging their US counterparts. In fact, the ratio of the S&P 500 to the VEU ‘rest of world’ equities ETF has pushed a fresh record high through the close of this past week. There is a modest bias towards holding speculative exposure, but certainly not the deeply set enthusiasm that the US indices represent with record highs and long stretches of gains. That is an important distinction as struggles could rise seemingly out the blue; but in reality, it could simply be the recognition of the fundamental score.
Chart of S&P 500-VEU ‘Rest of World Equity’ Ratio with 100, 200-Day SMAs and 200-Day Disparity (Daily)
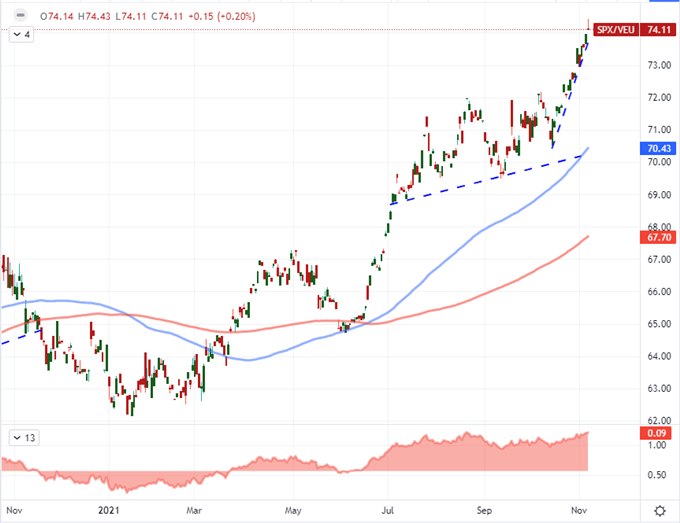
Chart Created on Tradingview Platform
The Systemic Themes are Easing: Monetary Policy and Growth Forecast
Over the past few weeks, there have been some serious fundamental events that would in turn threaten to tap into systemic matters. The influence of leveled growth forecasts faded as the official 3Q data was in the rearview and the backside of the earnings season shifted into single names rather than broader sectoral themes. Monetary policy was the top consideration, but the measurable shift towards normalization for the major central banks reporting didn’t seem to generate the kind of response we would have otherwise have expected. The Bank of England has warned a rate hike is coming, but it didn’t move at this meeting as aggressive forecasts had assumed. For the Reserve Bank of Australia, the end of the yield curve control program was overlooked as traders hungrily speculated on a later rate hike launch. As for the Federal Reserve, the taper was exactly in line with expectations and there was little to truly change the perspective for active tightening moving forward; but global yields would retreat regardless. It seems the pressure has eased as traders look to squeeze more short-term opportunism out of the system before the slow shift in monetary policy actually hits the bottom line.
Perception of Relative Monetary Policy Position for Major Central Banks

Chart Created on Tradingview Platform
Looking out over the coming week, there is a notable downgrade in systemic fundamental matters. There is, however, plenty of high profile scheduled event risk that traders should be mindful of. Perhaps most notable for its connection to active market themes over the past weeks is the US inflation data – both consumer and producer stats. Outside of that, there is a last gasp of meaningful earnings for the third quarter in the form of meme favorites and pandemic IPOs. Updates from the likes of AMC Entertainment, Palantir and Aurora Cannabis while compete for attention from Coinbase and Doordash. For further macro updates, China’s trade balance, the Eurozone’s and Japan’s economic sentiment surveys and the UK’s GDP update are all worth of our watchlist.
Calendar of Major Macro Event Risk for the Week
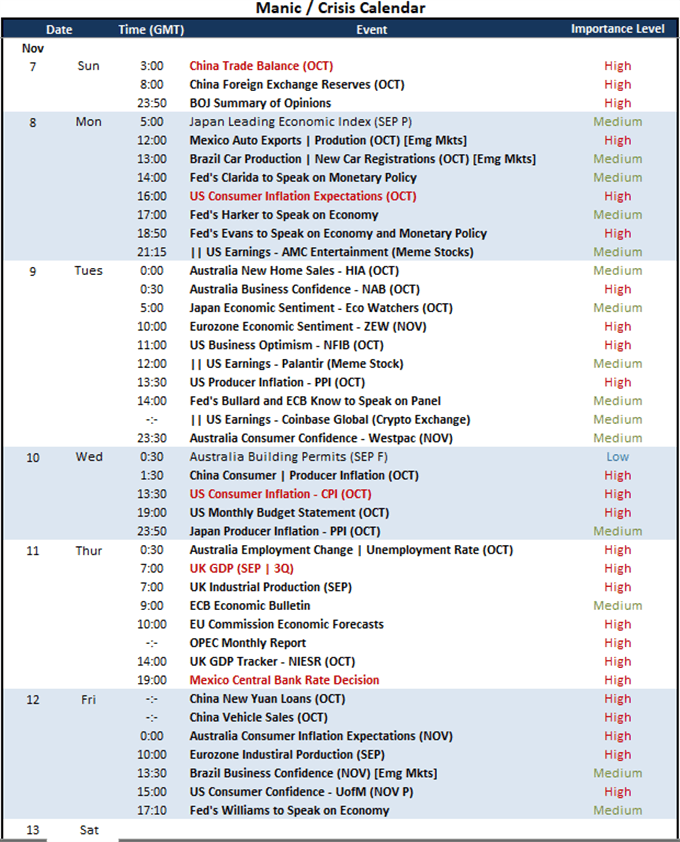
Calendar Created by John Kicklighter
Among the Top Tickers for the Week Ahead
I’m watching a number of markets over the coming week as the curb in systemic fundamental drivers will push the focus to more targeted developments in different areas of the market. For the US Dollar, the lack of traction from the Fed’s confirmed taper both raises eyebrows and shifts opportunities. The trade-weighted DXY Dollar Index failed to break 94.50 range resistance after the confirmation while rate forecasts for 2022 faded even though nothing material shifted in the fundamental web to suggest the outlook had softened. The week ahead may yet offer a second wave of support on inflation data and consumer sentiment – or perhaps even a risk move – but either way, EURUSD is an interested technical picture. It is at the major range support around 1.1500 as a descending tend channel has pulled resistance down to 1.1650.
Chart of EURUSD with 20-Day SMA with ‘Wicks’ (Daily)
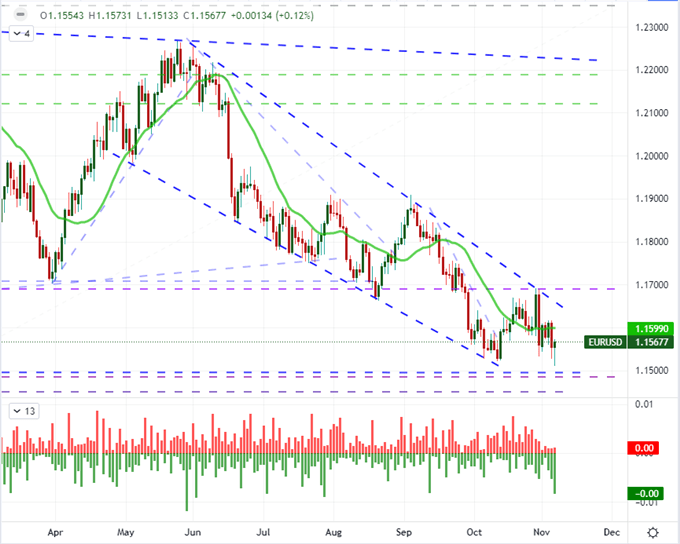
Chart Created on Tradingview Platform
Distinguishing risks trends and interest rate appetites can be difficult. However, USDJPY is in a good position to determine which drive is carrying greater weight – or it can align the multiple drivers to a more intense charge. This pair has carved out a statistically tight range over the past 15 trading days, but its realized volatility (ATR) over the same period is holding distinctly high. This is a break risk to which I will remain agnostic on direction. That said, follow through is best served by a clear fundamental drive to earn the technical move.
Chart of USDJPY with 200-Day SMA, 15-Day Range and 15-Day ATR (Daily)
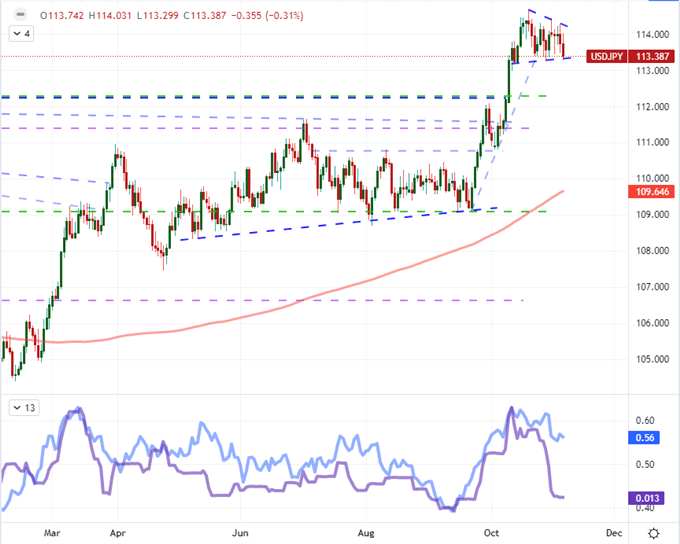
Chart Created on Tradingview Platform
While I’m watching the likes of the Nasdaq 100, GBPJPY and single share tickers of BBBY and TSLA in the week ahead; one fundamentally-based outlier that is also on the agenda will be USDMXN. The Mexican Central Bank is the only large monetary policy authority on tap expected to update on its policy mix. This has been an active group and the bigger spectrum of monetary policy in the midst of a serious steer towards normalizing. That said, I think the existent volatility for the pair is a good foundation to stir speculators to action.
Chart of USDMXN with 100-Day SMA and 5-Day ATR(Daily)
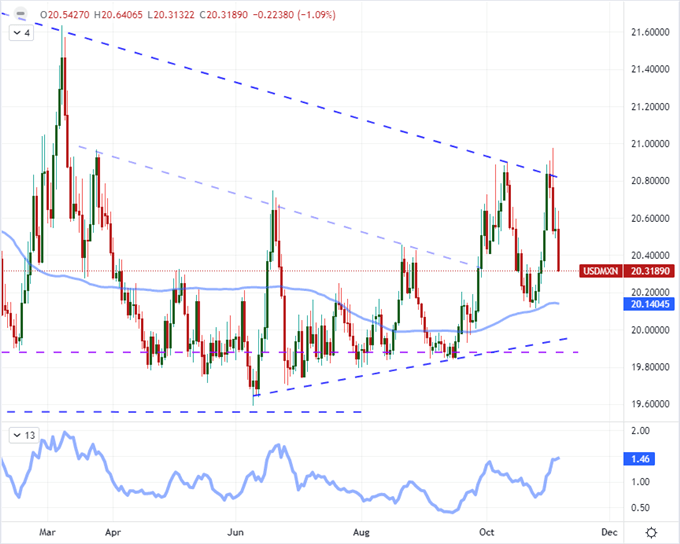
Chart Created on Tradingview Platform


