


S&P 500, Bitcoin, EURUSD, EURJPY, Tesla Talking Points
- The Dow managed to broach a record high during intraday trade this past session, but the S&P 500 notably fell short of the critical mark
- Bitcoin on the other hand surpassed its high water mark but now bulls will need to gauge their enthusiasm to carry forward the trend
- US, Canadian and UK rate forecasts have struggled to lift their relevant currencies, Yen crosses have stretched their run and Turkey’s central bank is on tap

The S&P 500 Teases While Bitcoin Secures a Fresh Record
Risk appetite across the global financial system is still distinctly uneven. And, if there isn’t a consistency, it will remain incredibly difficult for individual assets to prompt major technical breaks – much less lay the foundation of meaningful follow through to fresh records. There were a few highlights among the ‘risk’ sensitive rank such as the Dow’s intraday record high (though not on the close), Bitcoin’s distinct clearance of its previous September record and EURJPY (among other Yen crosses) advancing to a 10th consecutive bullish session. Yet, the benchmark that I have been focused on most closely for its representation in portfolios – the S&P 500 – very noticeably drug its feet this past session. The index managed to earn a sixth straight day’s advance for the longest run in three and a half months, but for bulls it was maddeningly short of its record high coming up less than 6 points short of its intraday record and less than one index point shy of a record close. Once again, the upcoming docket offers little that could reasonably be expected to serve as motivation for follow through. If we cross the technical boundary without a more definitive fundamental motivation, follow through will suffer.
Chart of S&P 500 with 50 and 200-Day SMAs, Consecutive Candles (Daily)
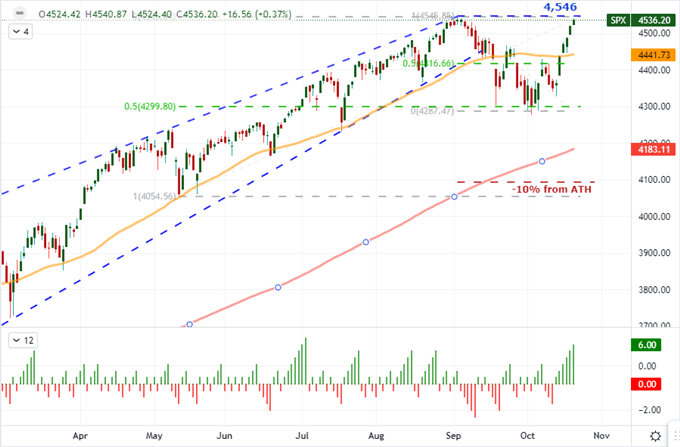
Chart Created on Tradingview Platform
Looking the S&P 500’s dawdling just below its own record high, the wider world of risk assets continues to dampen enthusiasm with a mixed performance that is unfolding much further from major levels of resistance. Major European and Asian indices are still meandering, emerging market (EEM) were virtually unchanged, junk bonds spun their tires, though carry trade stretched a little further in their epic rally. All that considered, no other prominent risk asset quiet lived up to the same performance as Bitcoin. The most liquid cryptocurrency finally managed to overtake previous high in April and the $66,000 mark in the effort. We’ve seen the market work towards this event for some time, and the start of trading for the ProShares Bitcoin futures-based ETF on Tuesday seems to not have been fully baked in. That said, this is a risk-sensitive asset and there isn’t anywhere near the same sentiment of strength in other cryptocurrencies, big or small. There is little disputing the drive of an approximately 50 percent rally on the month, but don’t conflate this performance with a broader conviction.
Chart of Bitcoin with 20-Day SMA, Overlaid with Dollar Index (Daily)
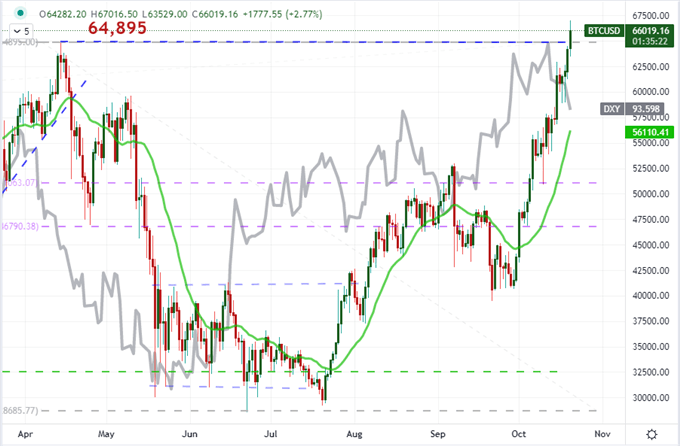
Chart Created on Tradingview Platform
Rate Forecasts are Starting to Flag
Though it was competing with headlines like Bitcoin’s record high and the S&P 500’s struggle to earn the same accolades, the most prolific macro headline on my radar this past session was interest rate expectations. Both the UK and Canada issued September inflation data with the former’s data slightly softer (though still above target) while the latter hit an 18-year high. There was hawkish weight to the event risk, but neither the Pound nor the Canadian Dollar would exhibit any enthusiasm. For the Dollar, the Beige Book started the two-week countdown to the next FOMC rate decision that is likely to announce the taper; but the Dollar was not in a position to recover lost ground. Fed rate forecasts for 2022 were fairly flat at 37.5 basis points, but the EURUSD would still edge higher. This is a ‘path of least resistance’ technical move, but it is still best to find momentum in a range swing is distinct fundamental influence. Perhaps the Fed speak on tap today will rouse the market.
Chart of EURUSD Overlaid with Fed Forecasts 2022 and Correlation 10, 60-Day (Daily)
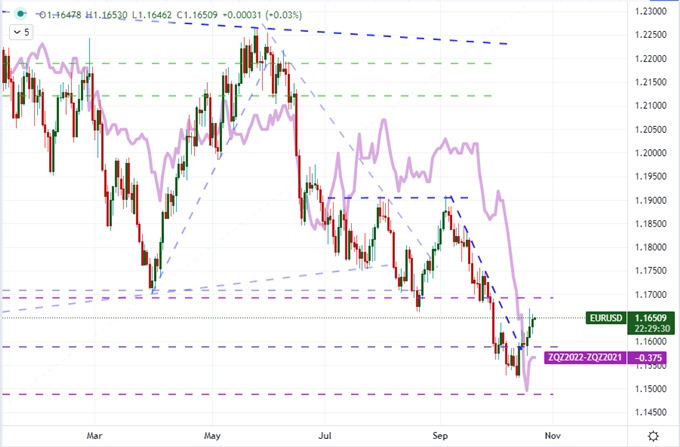
Chart Created on Tradingview Platform
From the perspective of a singular central bank’s monetary policy intentions to a global overview of a shifting path forward, it is important to keep track of the connection to general risk appetite. Eventually, this is a matter that can spread to global indices, but my immediate interest in the tempo behind the collective swell in monetary policy is the performance of the Yen crosses. There are a host of impressive technical runs among these pairs including USDJPY, AUDJPY, CADJPY and NZDJPY. However, all of these crosses carry the mark of a varying outlook for eventual interest rate hikes. EURJPY on the other hand is guided by the Euro and thereby the ECB. That said, this central bank has attempted to position itself as extremely accommodative through the foreseeable future – even if the market is leaning against that commitment. This raises serious suspicions from me as the pair closes an incredible 10-day consecutive advance. That is the longest charge in 12 years and only the third instance in the Euro’s history that this particular pair managed a bullish run through this level of consistency. I believe a correction is overdue, but will wait until some technical support gives.
Chart of EURJPY with 20 SMA, Consecutive Candles (Daily)
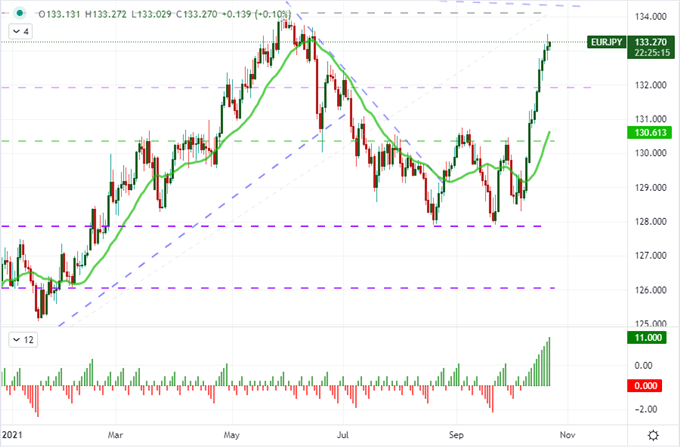
Chart Created on Tradingview Platform
While I will be watching Fed speak and the Yen crosses’ commitment through the coming session, there isn’t a direct scheduled event risk to suspect a supercharged volatility one way or the other. That said, the horizon is not totally devoid of reliable market moving event risk. Most notable, we have the Turkish Central Bank rate decision. You might recall that the central bank already cut its benchmark rate 100 basis point outside his normal scheduled policy meetings. Economists and rating agencies said the move undermined the group’s credibility as it failed to address oppressive inflation. Now, we are coming up to the regularly scheduled follow up to September’s surprise and there is a hearty group that expects another slash at the 18 percent benchmark rate. If that were two happen, would the Lira’s collapse be revived? It’s likely.
Chart of USDTRY with 50-Day SMA and Disparity Index (Daily)
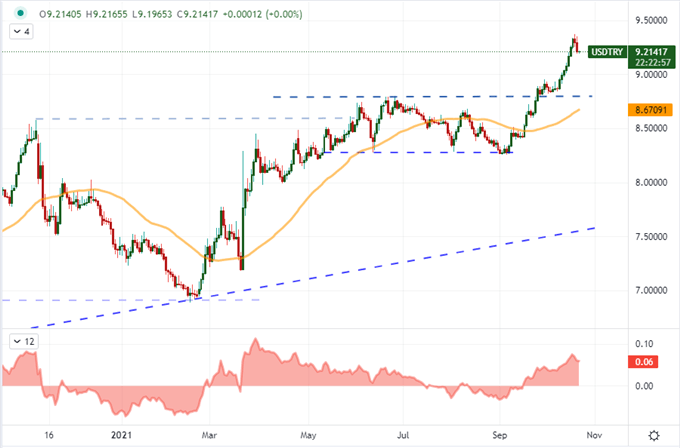
Chart Created on Tradingview Platform
Event Risk and Markets to Watch for Thursday
In scheduled event risk, there are a range of noteworthy but not market-moving releases on tap – including Canadian private payrolls, Fed speak, Eurozone consumer confidence and UK business sentiment. I will be watching for Friday’s October PMIs as a timely update to the developed world economy, but in the meantime, earnings is still an active source of activity. After the close on Wednesday, two important US companies reported their respective financial performance. CSX is an important macro crossroad representing both economic activity and also the supply chain constraints so frequently in the news. That said, the beat from the shipper ($1.86 EPS versus $1.67 expected) could soothe fears. Yet, where the real heft can be felt is the Tesla earnings. It too would beat on the top and bottom lines with a very hearty delivery growth forecast to boot. Nonetheless, TSLA traded lower in afterhours trade. I want to see how both performance on the open Monday, but Tesla is front and center. Resetting the cycle, the post close on Thursday will bring Intel and Snap figures.
Chart of Tesla with 50-Day Moving Average and Volume (Daily)
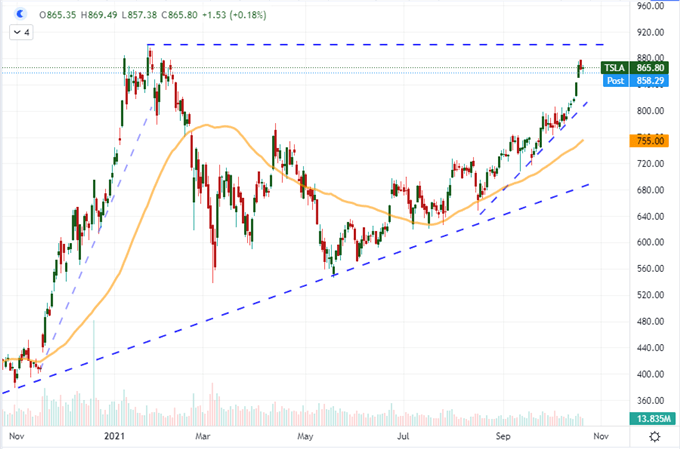
Chart Created on Tradingview Platform
From scheduled fundamental friction to the abstract, the Chinese markets should be particularly interesting through the upcoming day’s trade. After an unexpected surge from the Yuan Tuesday, USDCNH reversed off a multi-year trendline support to jump back into range. Into early Thursday trade, we saw Evergrande begin trading again after approximately three weeks of closure. The company has not resolved its exposure issues, and the market will now be watching this stock as a gauge of how much control the government has for a control descent.
Chart of USDCNH with 50-Day SMA (Daily)
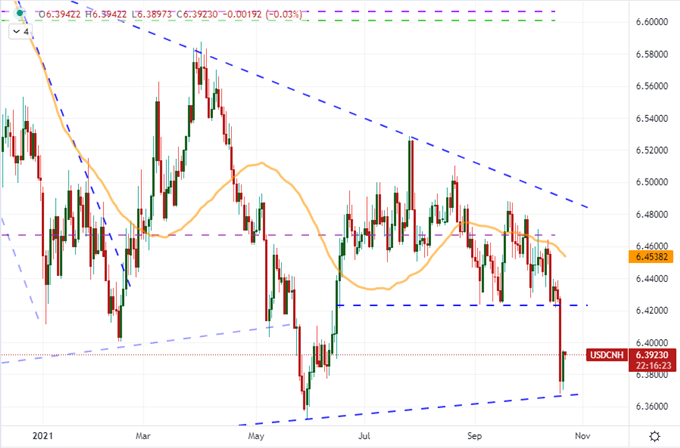
Chart Created on Tradingview Platform


