


S&P 500, VIX, Dollar, USDJPY, EURUSD and GBPUSD Talking Points:
- Markets suffered an unexpected bout of volatility this past session with large gaps lower for the S&P 500 and other US indices
- Fear around the delta variant of the coronavirus, a slowdown in economic activity, and a tightening rate forecast were reasons offered for the risk aversion
- The Dollar finally took a spill, leading to a USDJPY breakdown, a EURUSD range and hesitation for GBPUSD at range support

An Unexpected Surge in Volatility
I was fully prepared to watch market activity settle into the close of the trading week, but a broad and intense surge in risk appetite this past session seemed to flip the script. From my favorite ‘one-look’ measures for sentiment, the day was very prescriptive. The S&P 500 led the US indices with a large bearish gap lower to open Thursday’s session. For the SPDR ETF, the bearish gap was the sharpest open lower in nine months. That said, the correction came from a previous day’s record high and the markets recovered lost ground through the active trading session – though not enough to offset the initial losses. Heading into he final trading day of the week, the pertinent question is whether the sudden slump has motivations that run deep enough to counter the weekly, monthly and systemic curbs on market activity. Though I prefer volatility, there is good reason to doubt the market’s commitment to a productive bear trend. First and foremost, it is not clear what theme was in charge of the market’s slide. With a targeted docket – particularly for the UK and Canada – through Friday and a busy week ahead, my skepticism for late-in-the-week momentum is high.
Chart of the SPDR S&P 500 ETF with Volume, 100-Day Moving Avg and Gaps (Daily)
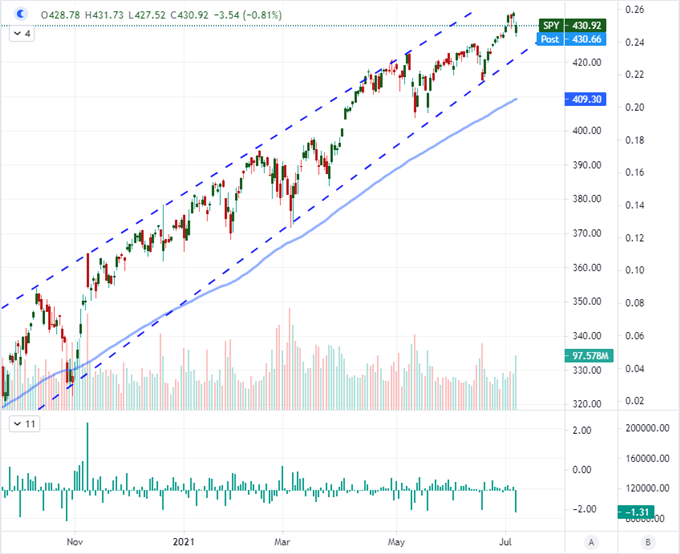
Chart Created on Tradingview Platform
While I may be dubious of how much momentum the markets can muster in the twilight hours of the trading week, there is little doubt that the tumble in ‘risk assets’ this past session was a broad move. Through equities, the DAX 30 looks to have progressed a head-and-shoulders reversal while Japan’s Nikkei 225 is on the cusp of breaking a large descending triangle. Junk bonds, emerging markets and carry trade (Yen crosses) were also carving out similar patterns of retrenchment which speaks to the breadth of risk aversion. The strong correlation across otherwise loosely related assets suggests that sentiment was indeed at the root of the market’s remarkably active session. That said, a break out does not automatically guarantee follow through and a jolt of volatility does not inherently signal a true trend. I am constantly vigilant for a systemic trend for the financial system but experience has suggested it is worth holding a healthy sense of skepticism for ‘desirable’ market conditions.
Chart of Risk Trend Strength
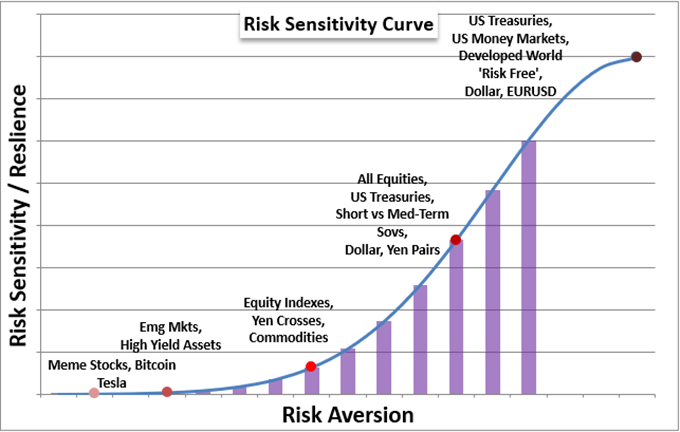
Chart Created by John Kicklighter
There are two critical elements to the market for translating short-term volatility into a full-blown trend: the fundamental patron to a systemic move and favorable market conditions. For the former consideration, there were a few accusations thrown around for the bearish sentiment. Concern around the delta variant of the coronavirus gaining traction is a global matter. That said, there has been plenty of rhetoric from global leaders that they will avoid a full economic shutdown such that further cases may not translate into immediate economic traction. Another consideration is the remarkably broad shift among major central banks to normalize monetary policy from an extreme dovish position. The emerging markets are a particularly good barometer for this concern. Meanwhile, growth itself is starting to show overt signs of slowing from the post-pandemic recovery surge. This is natural but not at all what over-extended bulls want to see. Evidence of a slower expansion – like the ISM service sector report earlier this week – will exert particular weight with this aggressively optimistic market. I would argue that sentiment itself is responsible for some of our recent extreme volatility. Market participants find themselves in stretched positions relative to traditional value measures which will unnerve the suddenly introspective. That said, market conditions remain a moderating force in the markets. While the VIX rallied as high as 21 Thursday and settled at 19, it is still a long way from a persistent flight in activity levels.
Chart of EEM ETF with 100 DMA Overlaid with Gaps and VIX Volatility Index (Daily)
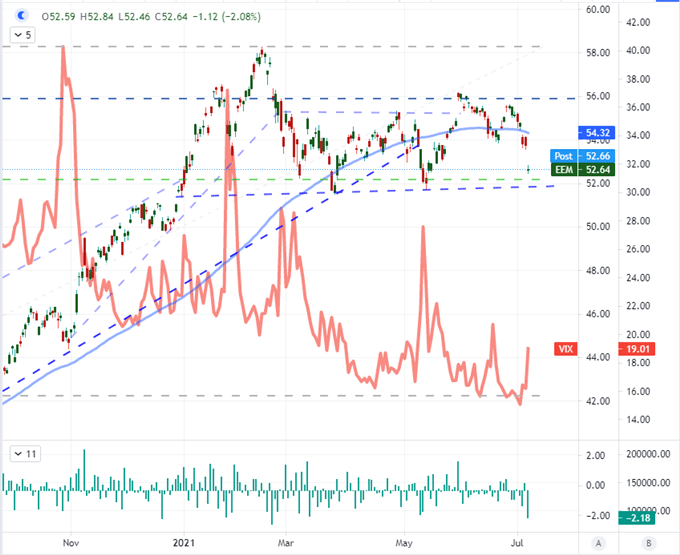
Chart Created on Tradingview Platform
Interest Rate Expectations Slip and So Too Does the Dollar…Finally
One of the side effects of the concern around normalization in monetary policy is the recognition that excessive risk exposure by market participants carries greater consequence without the presumed limitless backstop of deep-pocketed central banks. It seems that these factors may have caught up to the US Dollar this past session as the persistent fall in the US 10-year Treasury yield (below 1.30) exerted greater pressure on interest rate expectations (now below 16 bps priced into the end of 2022) and therefore curbed some of the enthusiasm for the Greenback for its relative yield. If risk appetite and growth forecasts are slowing – and there is every reason for them to do so – it is natural that the Dollar would ease; but I don’t believe that monetary policy normalization across the globe is permanently stymied. With so many developed and developing central banks discussing tempering their accommodation or taking actual steps to do so, there is a greater support to carry forward.
Chart of DXY Dollar Index with Implied Fed Rate Hike Through 2022 and 20-Day Correlation (Daily)
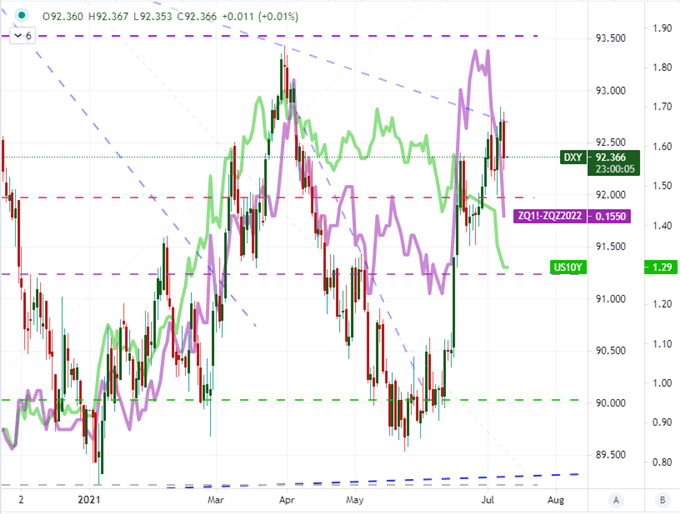
Chart Created on Tradingview Platform
The Different Technical Faces of the Dollar’s Progress
With risk trends in question and the fundamental motivation fighting against difficult market conditions, it is difficult to determine what the intentions are for Friday and beyond. However, the Dollar and its crosses have options for different outcomes. The most dramatic of the majors this past session was USDJPY which capitalized on the combination of general risk aversion (bearish Yen crosses) and the pullback of the US currency to amplify a clean break of this pair’s bullish channel stretching back to the start of 2021. If either fundamental wind persists while the other eases up, there is still momentum that can be found here.

Chart of the USDCAD with 20 and 100-Day Moving Averages (Daily)
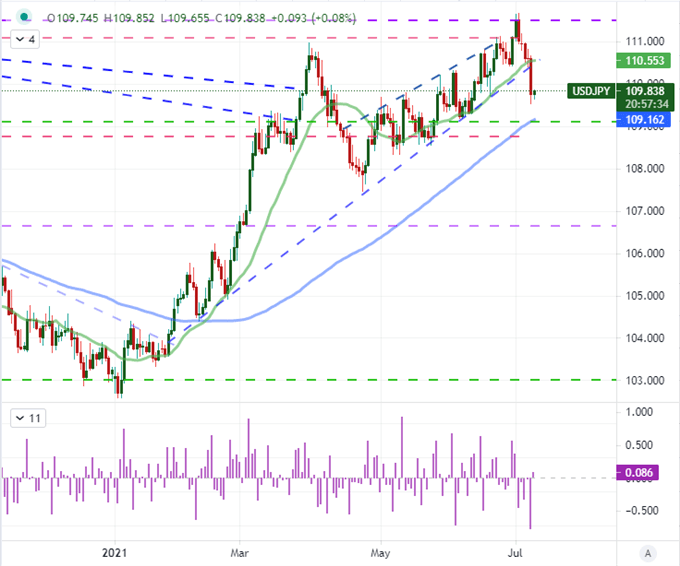
Chart Created on Tradingview Platform
In contrast to the ‘breakout’ from USDJPY, EURUSD’s volatility supported a broader range. The reversal all of trendline support around 1.1800 maintains a pattern that is nearly 12 months old. Technically speaking, this is a path-of-least-resistance resolution and thereby a more appealing shift for potential follow through. On the other hand, there isn’t a particularly pointed catalyst to carry us through an active Friday. There isn’t anything on the docket that I would consider to be critical for either the US or European currencies and their respective liquidities dampen a lot of the systemic matters like risk trends. However, if we are coasting, perhaps there is a range swing that can play out until the next meaningful fundamental motivator.

Chart of the EURUSD with 20 and 100-Day Moving Averages and 50-Day Disparity Index (Daily)
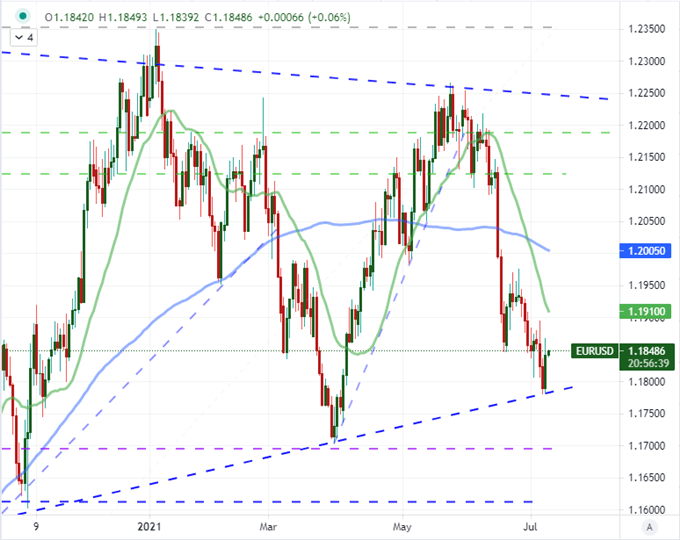
Chart Created on Tradingview Platform
In contrast to the (admittedly different) resolutions of USDJPY and EURUSD, GBPUSD refused to resolve its dwindling congestion. The Cable has worked itself into a terminal range that seems like it would naturally break sometime next week with the proper catalyst. However there is potential for the cross to clear the 1.3800 / 1.3725 congestion before the weekend fully drains liquidity. The UK docket carries monthly GDP, trade activity and industrial production statistics to be released Friday. Though liquidity will drain quickly, the technical bounds are tight; so I will be watching this and other Sterling crosses more closely.

Chart of the GBPUSD with 20, 100 and 200-Day Moving Averages (Daily)
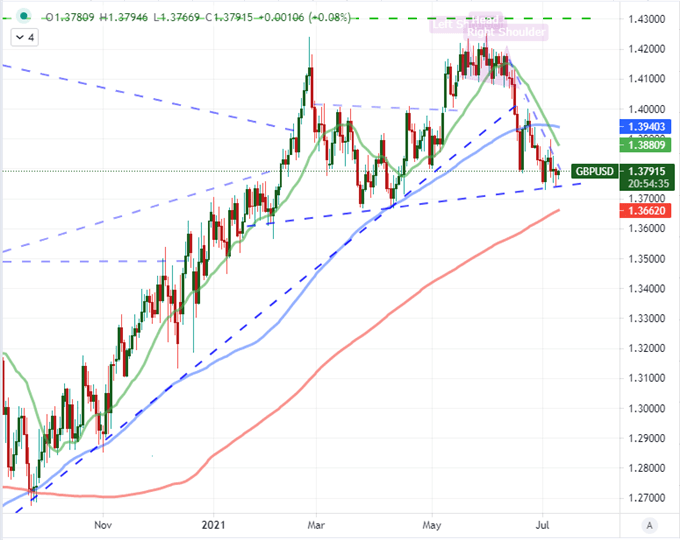
Chart Created on Tradingview Platform

.


