


S&P 500, VIX, Dollar, USDCAD and EURUSD Talking Points:
- Another slip in the S&P 500 and other risk-tuned benchmarks would find a late-in-the-day recovery as the markets struggle for clear direction
- Volatility levels remain exceptionally low with few critical events on tap to stir eddies of activity in the market
- Fed rate expectations remain a lurking underlying theme but the slide in Treasury yields is pulling away from Fed Fund futures and the Dollar, making EURUSD’s range interesting

Another Attempted Risk Reversal Cut Short Amid Low Volatility
The jolt of volatility that followed the US market’s return from the extended holiday weekend Tuesday didn’t build on its head of steam through this past session. Though the S&P 500 managed to break its 7-day bullish streak, the technical event didn’t lead to a full-blown risk aversion move. The index was underwater through early trade Wednesday, but the ‘buy the dip’ mentality came back into full form to prevent a new lower low and subsequently establish another, larger lower ‘wick’ on the daily candle. The tipping point for a systemic sentiment – bullish or bearish – is exceptionally high; and the scheduled event risk through the next 24 hours is thin and regional specific. Among the trackable fundamental themes still lurking in the background, rate expectations remain the most tangible theme for market-wide sentiment and relative volatility. That keeps interest in the major Dollar crosses, but it is theme with far greater scalability given the undercurrent.
Chart of the SPDR S&P 500 ETF with Volume, 50 and 100-SMAs and ‘Wicks’ (Daily)
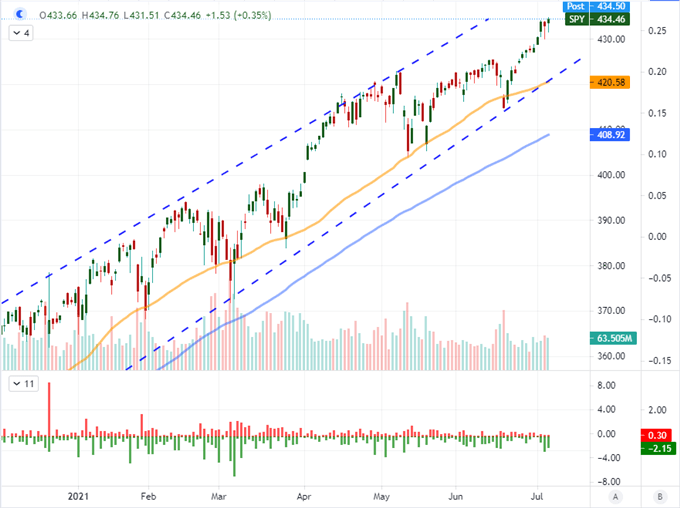
Chart Created on Tradingview Platform
Looking at the ‘quality’ of risk trends that are inching into progress on a daily basis, there was a pullback in the priority around momentum this past session. The ratio between the Nasdaq 100 (‘growth’ index) and Dow Jones Industrial Average (‘value’ index) opened to a strong jump but eventually closed slightly lower versus the previous trading days. More broadly, European and Asian indices are carving out distinct ranges while Yen crosses are leaning lower and crude oil has slid heavily for a second straight session. There is little consistency along the speculative dimension which suggests there is little imminent pressure for risk appetite.
Chart of the Nasdaq 100 to Dow Jones Ratio with 10-Day ATR (Daily)
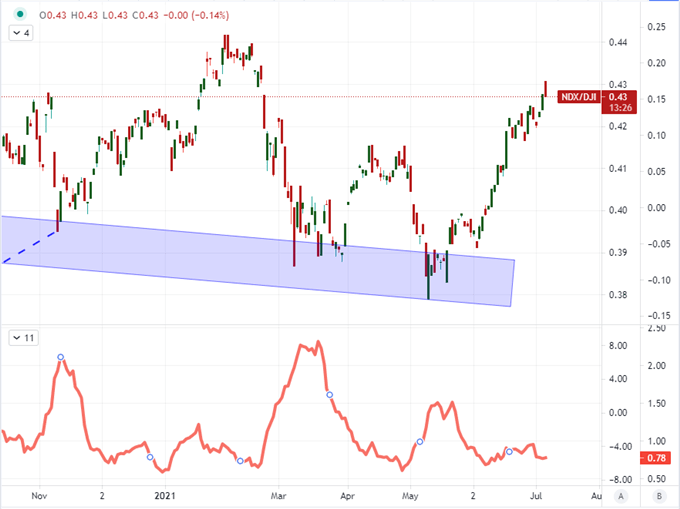
Chart Created on Tradingview Platform
Market conditions derived from collapsed correlation across loosely related assets is one of my preferred measures of the critical fundamental theme. However, underlying it all is the liquidity, volatility and biases that can foster a technical break of scheduled event risk into the dawn of a new prolific trend…or suppress it. Volume and open interest are not as low as similar periods in the past known for extreme quiet – like the second half of 2017 – even though realized activity levels may be on a similar level. The market-favorite VIX volatility index refused to gain critical traction yet again this past session, settling the measure back to 16.2. The low market since the pandemic started remains the 15 reading late last week, but a collapse of 14 would truly tip the market into the sense that we have fully entered a ‘summer doldrums’.
Chart of VIX Volatility Index with 20-Day Moving Average (Daily)
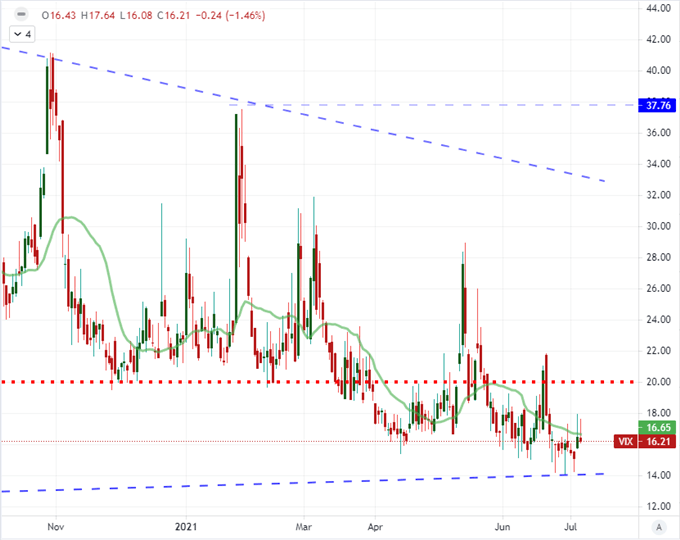
Chart Created on Tradingview Platform
FOMC Minutes Remind That Taper Is Ahead, But When?
Back on June 16th, the Federal Reserve issued their updated interest rate forecasts as part of the SEP (Summary of Economic Projections) that accompanied their decision to keep rates and the stimulus regime unchanged. Shifting projections from a low probability for a rate hike before the end of 2023 to calling for two quarter-percent increases through that year and debate of a first hike in 2022 was a sharp hawkish shift. Part of that time frame shift would include a shift forward in timing for all the monetary policy steps that would precede the first hike, including the taper timeline. For more insight on that discussion, the FOMC’s minutes this past session stated “in coming meetings, participants agreed to continue assessing the economy’s progress toward the Committee’s goals and to begin to discuss their plans for adjusting the path and composition of asset purchases.” The timing remains dependent on reaching “substantial further progress”, but it is more clearly a matter of ‘when’ which suggests closer proximity. Nevertheless, the Fed Fund futures are still sporting a softer view of relative to the conviction from late last week of a certain view of a hike by December 2022. The tumble has slowed, but the Dollar continues to defy the retreat. That could be read as a stubbornness in favor of the Greenback.
Chart of DXY Dollar Index with Implied Fed Rate Hike Through 2022 and 20-Day Correlation (Daily)
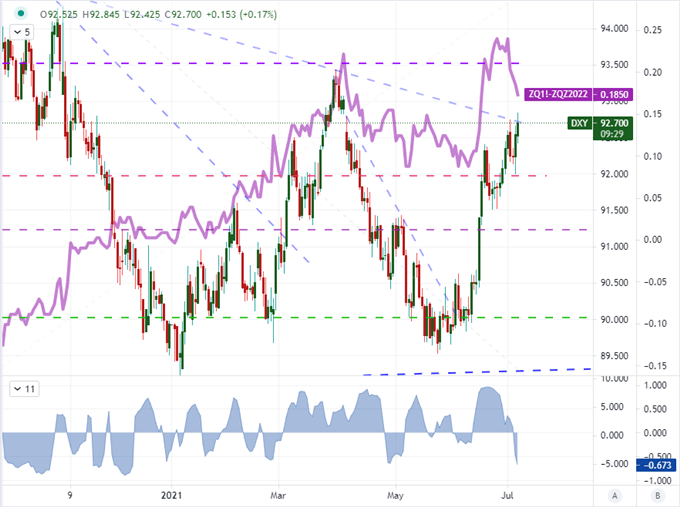
Chart Created on Tradingview Platform
However, before I attribute the same relentless that the US indices project to the Dollar, it is worth pointing out the growing contrast in the intensity of the Fed Funds projection relative to the slide in the US 10-year Treasury yield as it threatens to slip 1.30. The 10-day correlation between the two actually inverted. This disparity suggests that the Dollar is perhaps not the stretched outlier that it could otherwise be interpreted as with a one-dimensional comparison. Perhaps the stretched yield as pulling back in observation of a softened growth forecast. While that may also curb some of the intensity of rate speculation, there hasn’t been the same pace of extreme exuberance around hike speculation that we have seen in economic overheating.
US 10-Year Treasury Yield andFed Rate Hike Through 2022 and 20-Day Correlation (Daily)
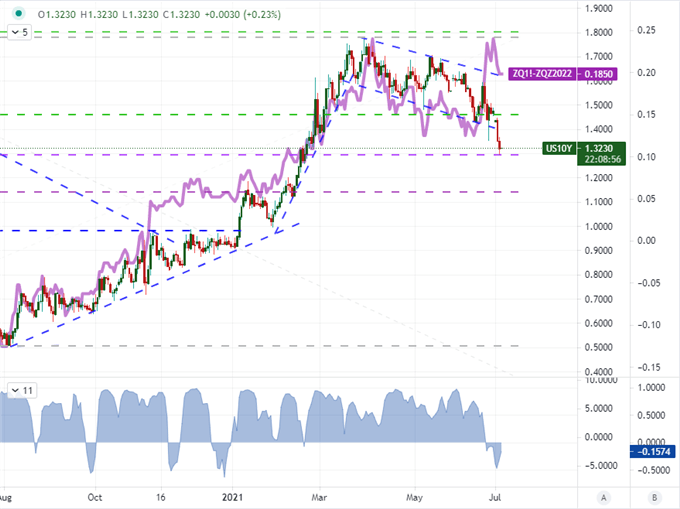
Chart Created on Tradingview Platform
What’s more for US monetary policy, it is less and less the extreme hawkish standout that many still seem to designate it. Both the Bank of Canada and Reserve Bank of Australia have announced tapers in their regular asset purchases. Among the larger emerging market central banks, there have actually been a handful of rate hikes. This eases the potential impact that measured US withdrawal of extreme accommodation can exact on the markets. Keep tabs on the collective and relative sovereign bond yields going forward.
Graph of Relative Monetary Policy Standings of Major Central Banks
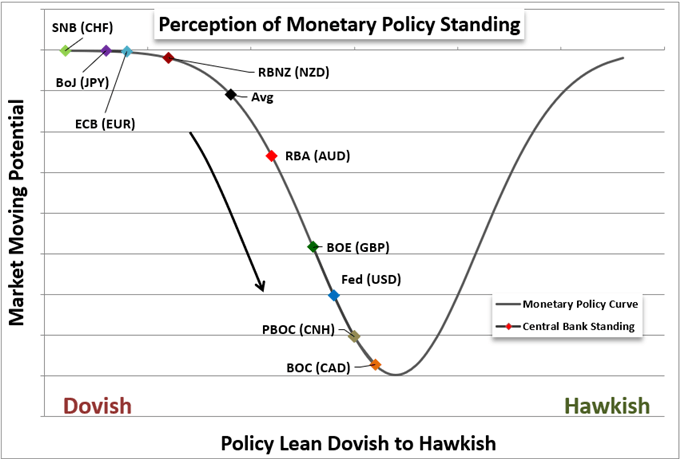
Graph Created by John Kicklighter
The Dollar-Based Major That Will Struggle and the One That Can Move
Combining the mix of provocative technical boundaries, a ready theme of US monetary policy influence and the market conditions of thinned liquidity; I remain observant of volatility but skeptical of trends. This is shaping my views on what setups look potentially productive and those that are sirens to the rocks. For the latter, the USDCAD break still looks like a pair of false hope. Having broke post-pandemic trendline resistance this past month, we have further this week seen a subsequent move to clear further trendline resistance that stretches back to November. I remain dubious of follow through with 1.2500, 1.2600 and 1.2650 imminent levels to trip up momentum readily.
| Change in | Longs | Shorts | OI |
| Daily | -2% | 7% | 5% |
| Weekly | -30% | 38% | 13% |
Chart of the USDCAD with 200-Day Moving Averages (Daily)
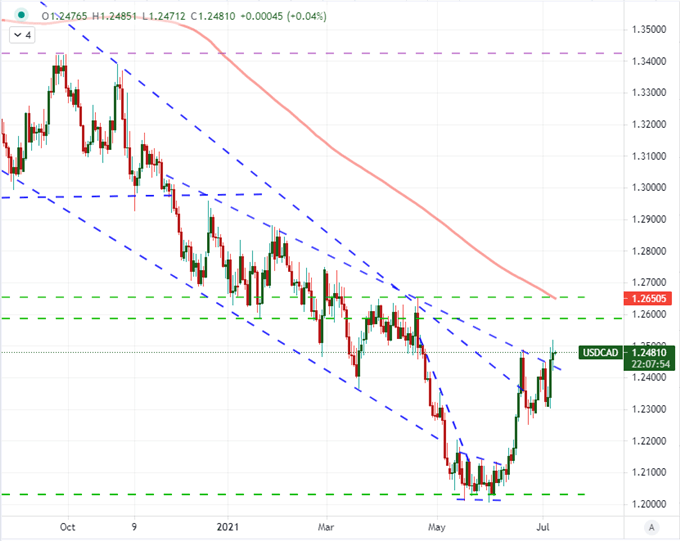
Chart Created on Tradingview Platform
In contrast, those same aforementioned ingredients make EURUSD more interesting. While there are pairs with tighter ranges like the USDJPY to contemplate – or the other crosses can be played to false-break fades – but there is a well-established and broad range for EURUSD. We have been to be at the floor of the wedge that starts with support back in July 2020. A break or rebound from 1.1800 is the current debate around the pair, but there is further support down at 1.1700 and 1.1600, tests for either would still hold the foundations of the broader trend. It is easier to move in a range than it is to find follow through on the break.

Chart of the EURUSD with 20 and 100-Day Moving Averages and 50-Day Disparity Index (Daily)
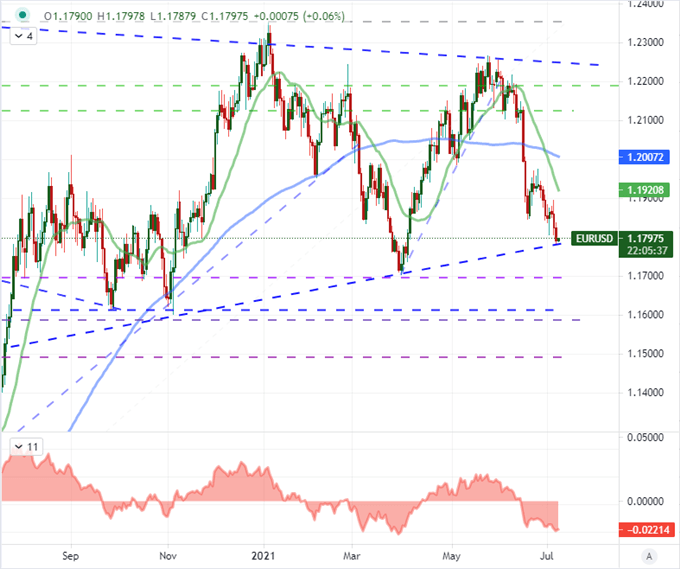
Chart Created on Tradingview Platform

.


