


S&P 500, Treasury Yields, Crude Oil and USDJPY Talking Points:
- The S&P 500 led a pullback in risk-oriented benchmarks this past week, but the technical milestones are not so critical as to fully reverse momentum
- A steady surge in global sovereign yield will remain a top focus into the coming trading week but vaccination rates and GDP through PMIs offer additional themes
- In addition to the broad set of ‘risk-leaning assets’, top markets to watch for significant technical or fundamental potential include crude oil and USDJPY

A Few Breaks in Risk Assets, But Is There Intent?
Technical breaks alone do not make trends. Commitment on the charts is found in follow through with fundamental motivation is critical for more than just creating a flashpoint. This past week, there were more than a few noteworthy moves on key charts. At the top of my watch list for warning flags was the retreat in the major US indices. While there wasn’t a full fledged momentum in the selling pressure throughout the week, there was nevertheless volatility and unmistakable cracks. For example, the S&P 500’s drop below 3,935 to break the fever of a driving record highs. Yet, full blown momentum would likely be reserved for a slide below 3,750 where the 100-day moving average happens to reside. Commitment could set in before that marker is reached, but a 12-month bullish bias is difficult to override.

Chart of SPY S&P 500 ETF with Volume and 100-Day MA Over Agg 10-Year Yield (Daily)
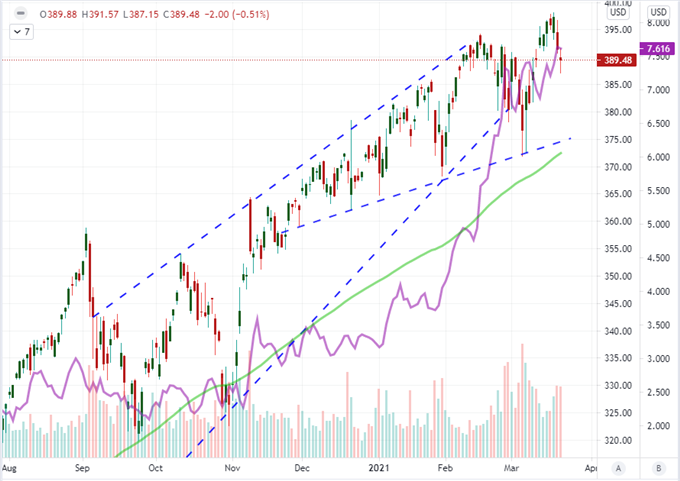
Chart Created on Tradingview Platform
When it comes to rousing true conviction in a course of risk trends – whether ‘risk on’ or ‘risk off’ – it can be somewhat abstract to gauge how such a broad market is positioned. I prefer to evaluate the potential on two dimensions: breadth and intensity. How many assets across different type and regions are aligned to a sentiment perspective? And, how strong is the drive to exercise the sense of fear or greed? While this past week would offer up a fairly broad slump along the risk measure, there wasn’t an unrelenting deleveraging. Traders should pick an array of assets that are loosely related (such as the S&P 500, DAX, EEM, HYG, crude oil and EURJPY) and evaluate how they are moving in relation to each other. When they align to strong declines, true risk aversion is more likely. When sentiment is on a self-sustaining course, true trends can catch.
Chart of Risk Appetite/Aversion Intensity
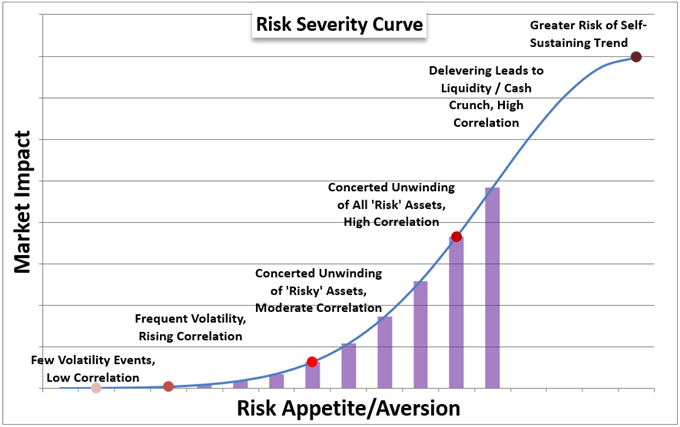
Chart Created by John Kicklighter
Systemic Motivators for the Week Ahead
In looking for a systemic driver for investor appetite, there are certainly fundamental themes that could be found in financial textbooks. However, I think it is important to hold out speculative indulgence as its own factor. Excessive exposure built over years of complacent optimism on the back of relentless central bank support has created an environment of inherent risk. We have seen this unfold anecdotally in the rise of meme stocks and cryptocurrencies over different periods; but there is also the tangible numbers in a surge in new retail accounts and search interest in dubious queries such as “buy the dip”, “penny stocks” and “day trading”. With the latest round of US stimulus ($1.9 trillion program from the Biden administration) more than half distributed, there is inherent assumption that more capital will weave its way into the market. Various surveys are aiming to track that liquidity infusion in the market, but a more familiar measure of indulgence may be the broker-level leverage measured at the NYSE – which was further ramped to a fresh record high through last month.
Chart of S&P 500 Overlaid with Broker Level Leverage (Monthly)
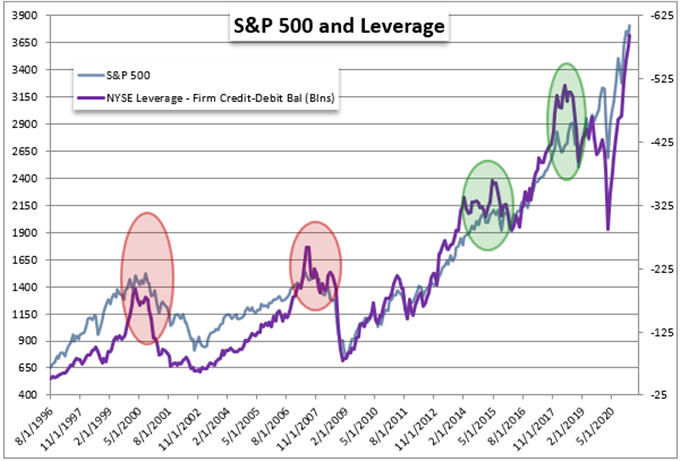
Chart Created by John Kicklighter with Data from Bloomberg and FINRA
Shifting focus to more classical fundamental theme, there is event risk on the calendar this week that can tap important undercurrents. In particular, the Wednesday run of March PMI activity reports from Markit for the Australia, Japan, Eurozone, UK and United States is a timely growth update as we await the official quarterly reports due from governments over the next two months. For more unrelenting influence as a fundamental driver though, the climb in yields can strike as a deeper seated fear: the eventual and inevitable withdrawal of support from central banks. This past week, the US 10-year Treasury yield closed above 1.71 percent for a seventh consecutive week’s advance. There have been three other runs of this duration back to 1994 (when there was an incredible 11-week move). Such a pace from record lows and against uncertainty of economic durability without the full weight of external resources can readily unnerve.
Chart of US 10-Year Treasury Yield Overlaid with Implied Fed Fun Futures Hikes to 2022 (Daily)
Chart Created on Tradingview Platform
Along similar lines as the rise in yields is the pressure on central banks like the Federal Reserve to remove some of the extreme accommodation built up over the past 12 years to avoid sparking a financial crisis in the opposite direction. I am particularly focused on what the US central bank does relative to its peers as it was the symbolic leader in adopting the massive programs so common today, its capital markets have paced the climb this past decade and it is fundamentally the largest economy in the world. That said, the market’s expectations for tightening by the FOMC have climbed to 11 month highs, pricing 16 basis points of tightening through the end of next year. That is a distinct contradiction to the group’s own commitment to hold near-zero beyond 2023.
Chart of DXY Dollar Index and 100 DMA with Implied Rate Hike from Fed Funds Futures (Daily)
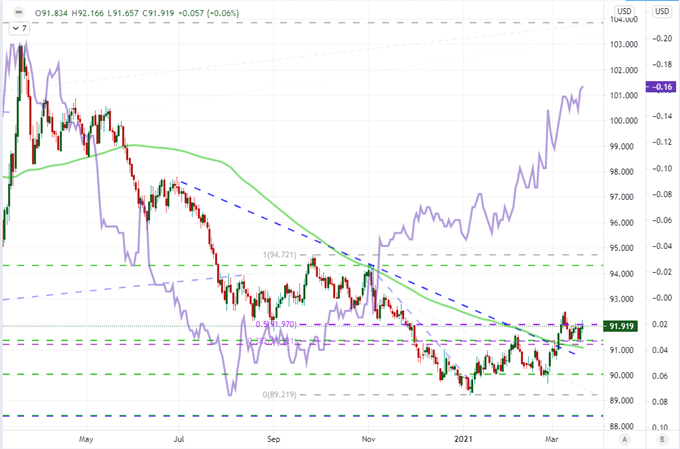
Chart Created on Tradingview Platform
Top Movers from the Retail Trader’s Perspective
While there is a lot to watch in the markets next week with more than a few short-term technical highlights, a few particularly noteworthy assets stand out for the fundamental and technical density. First is US-based WTI crude oil. The commodity took a nasty tumble Thursday that unnerved the commodity market, but the full break was not verified through Friday trade. A hold at the 50-day moving average now sets the next trip point, but this asset is particularly interesting to me as it is sensitive to risk trends and it is distinctly related to general economic activity.
Chart of US Crude Oil Futures with 50-Day Moving Averages and Volume (Daily)
Chart Created on Tradingview Platform
Taking a quick look at how speculators are acting amid this crude volatility, we find that the medium-term professional traders measured by the COT’s net speculative futures positioning has moved to its heaviest net long position since the week of July 27th (537,438 contracts). From the shorter-term approach of the retail CFD traders, the sharp break last week seemed not to rouse commitment to a new trend but rather incite an effort to fade in support of a prevailing trend. Though, it should be said that retail traders are particularly keen to trade ranges by picking short-term tops and bottoms even when they are not there.
| Change in | Longs | Shorts | OI |
| Daily | 0% | -7% | -2% |
| Weekly | -7% | 1% | -5% |
Chart of US Crude Oil Overlaid with Net CFD Positioning Among IG Retail Traders (Daily)
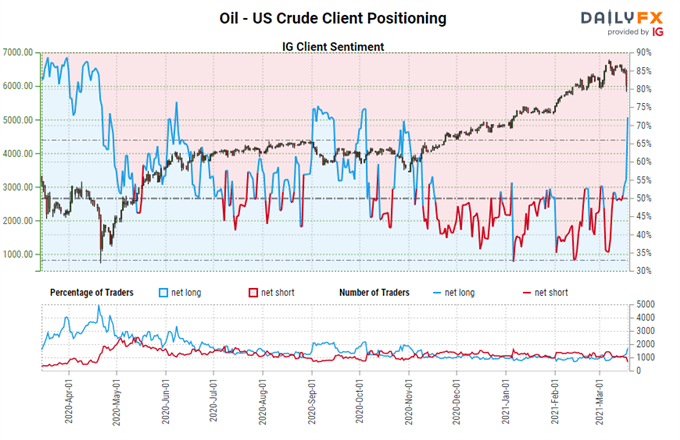
Chart from DailyFX.com
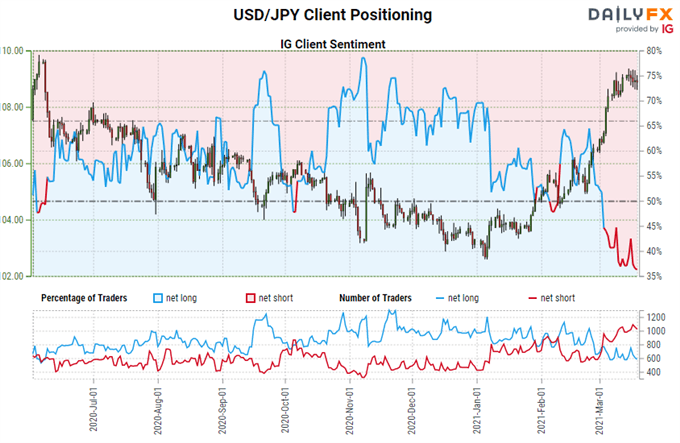
Another interesting assets that stands at the convergence of many fundamental themes is USDJPY. The pair is a particularly relevant reflection of relative monetary policy effort following the Fed and BOJ (Bank of Japan) rate decisions this past week. While the US central bank committed to stay the course, the Japanese group actually took tangible steps to ease back its extreme support via relaxing the bands on its JGB targets and scraping an annual ETF purchase target (though the Fed letting the SLR expire at the end of the month may be seen as a very early step to normalize). This pair is also a carry trade stalwart in a rising yield environment, so it is acutely sensitive to risk trends. From a technical perspective, we have a tight range after a more than 650 pip rally in 2021 thus far and heavy resistance overhead. A break seems in the cards and retail traders are (as expected) positioning for a top. I wouldn’t be so confident in the direction until actual progress is made.


.


