


S&P 500, EURUSD, FAANG, Gold Talking Points:
- The S&P 500 carved out its smallest three-day range since before the coronavirus volatility began five months ago – dubious restraint given the many technical ranges
- Aside from the constant but ill-defined risk presented by the pandemic resurgence, US earnings is a top event risk through the next week with releases from Tesla, Amazon and CSX
- Other key themes to track for catalyst potential for the likes of EURUSD, Gold and other benchmarks include the pandemic/vaccine headlines, global GDP via PMIs and stimulus skepticism
A Surfeit of Breakout Potential
There was potential to trigger quickly diminishing technical congestion patterns among major risk benchmarks through the end of this past week, but he opportunity passed with ranges still standing. Yet, looking out over the coming week, a break is a particularly high probability given the restriction on heavily traded markets – especially against the backdrop of systemically-important fundamental matters like US earnings; the state of the coronavirus pandemic and proxy growth updates on tap. There is perhaps no technical picture more representative of the backdrop than the S&P 500. The three-day ATR and historical range for this US (and world) speculative baseline to end this past week was the lowest seen since February 19th – notably the period before the Covid crisis response began.

Chart of S&P 500 with 20 and 200-Day Moving Averages and 3 Day Range (Daily)
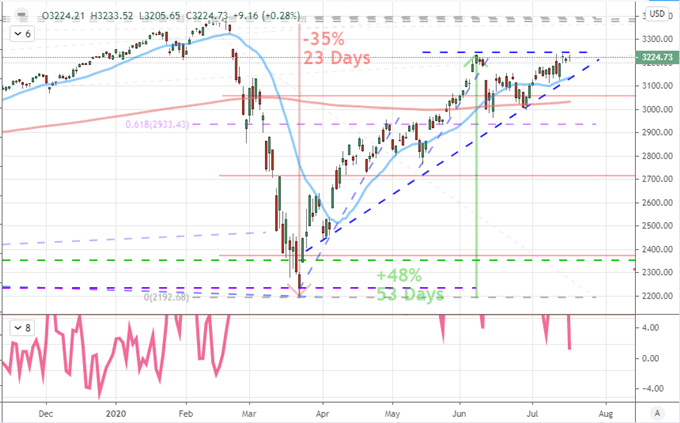
Chart Created on Tradingview Platform
The loaded consolidation isn’t restricted to the US benchmarks. Keeping the evaluation to the same asset class, there are a host of major indices around the world that are working their way into ‘terminal’ patterns that will have to resort in a break one way or the other. For a wedge or triangle that simple runs out of room, a break will eventually develop ‘out of necessity’ but that doesn’t ensure conviction for follow though. That is best served through event risk with systemic influence. For those looking beyond the SPX or Dow, the German DAX, UK’s FTSE 100 and Japanese Nikkie 225 present particularly potent charts.
Chart of DAX Index with 20 and 200-Day Moving Averages and 3-Day Range (Daily)
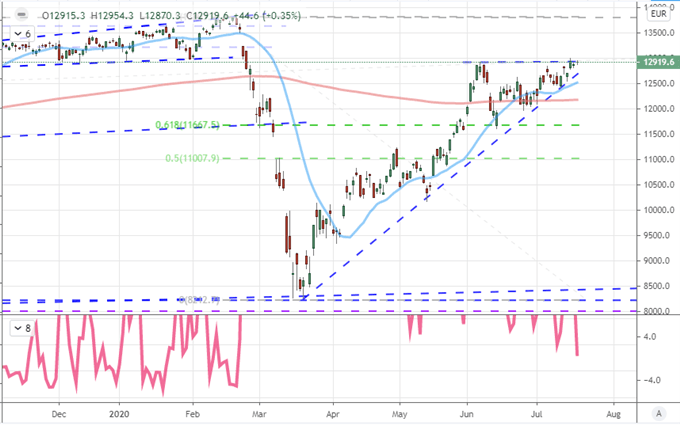
Chart Created on Tradingview Platform
Further beyond the influence of equities as an asset class, the risk aspect of market uncertainty shouldn’t be understated. Risk-sensitive commodities, high-yield ‘junk’ bonds, emerging market assets and carry trade measures are all tracking out consolidating tracks. Below, is a carry-sensitive currency pair that can sync its alignment to confidence further should the US-China standoff intensify.
Chart of AUDUSD with 50-Day Moving Average (Daily)
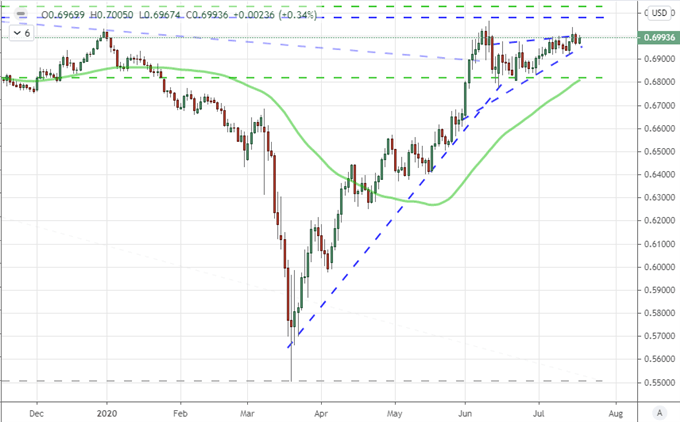
Chart Created on Tradingview Platform
While risk trends are the most potent opportunity for momentum, I won’t ignore options that have an abundance of their own fundamental matters. EURUSD for example has been a constantly harassed pair between build up in US-EU trade wars, stimulus competition and divergent growth forecasts. With the European Commission discussing its fiscal rescue program through Saturday, take stock of the benchmark pair from the very open of the week.
| Change in | Longs | Shorts | OI |
| Daily | -6% | 6% | 0% |
| Weekly | -20% | 45% | 2% |
Chart of EURUSD with 50-Day Moving Average (Monthly)
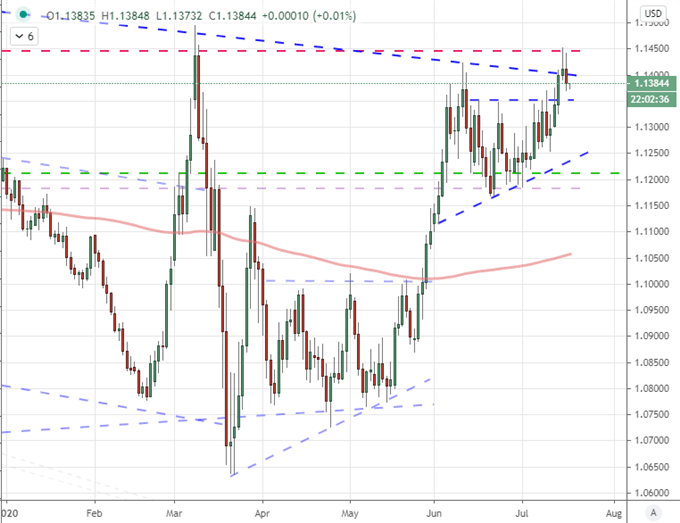
Chart Created on Tradingview Platform
The Fundamental Themes Capable of Fueling a Fruitful Break
A technically-driven breakout without a clear fundamental line for market participants across asset types and regions to follow will have a harder time catching and keeping traction. When a high-profile event or theme urges the chart-based break (or just happens to coincide with it if you’re a technical purist), the potential for a meaningful measure of trend is significantly higher.
This past week, the marker with the greatest possible sway on my radar was the Netflix earnings release after the close Thursday. As a measure of economic health, corporate performance through the previous quarter is a lagging indicator. However, there is a special standing among the FAANG members as these large market cap tech firms hold an almost sanctified status among traders these past months – and years. That said, the disappointing earnings report by this supposed Covid-immune company raised some serious question among Robinhood-driven, retail traders. In the week ahead, another official FAANG member is on tap (Amazon) while an honorary players (Microsoft) will cross the wires earlier. That said, I will keep a very close eye on the accounting from Tesla given its incredible – almost bubble-like – surge these past weeks.
Chart of Netflix, Tesla and Netflix (Daily)
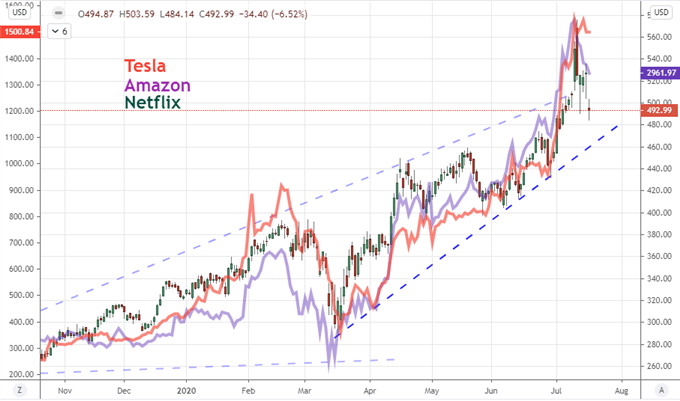
Chart Created on Tradingview Platform
Earlier in the week ahead, there will be a few noteworthy economic releases to keep track of; but market movement will likely hold more principled connection to systemic issues such as the headlines around the spread of the pandemic. Through this past week, the United States recorded a fresh record high in new daily cases having surpassed the 70,000 mark. With a number of states considering reversing course on their economic opening to halt the contagion, the outlook for the economy is looking particularly at-risk. On the other hand, reports of progress in vaccine trials by Moderna, Novavax, Oxford and others will cater to hope that this plague could be eradicated for good.
Google Report of US New Coronavirus Cases (Daily)
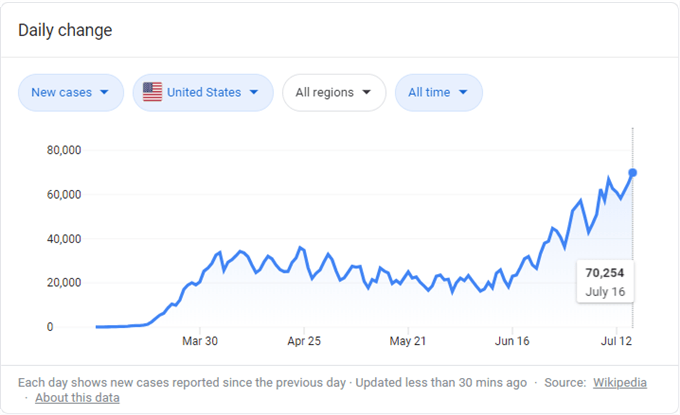
Chart from Google, Data from Wikipedia
Through the end of the week, the fundamental focus will shift to more traditional matters. Through Friday, we are due July business activity reports (manufacturing, service and composite) from Australia, Europe, the UK and US. The default expectation is for sustained recovery to fulfill the need for a ‘V-shaped’ recovery to justify the quick risk reversal these past four months. Beware if the data doesn’t live up to these needs. Learn how GDP can impact the Forex market.
Global Monthly PMI Reading and Quarterly GDP
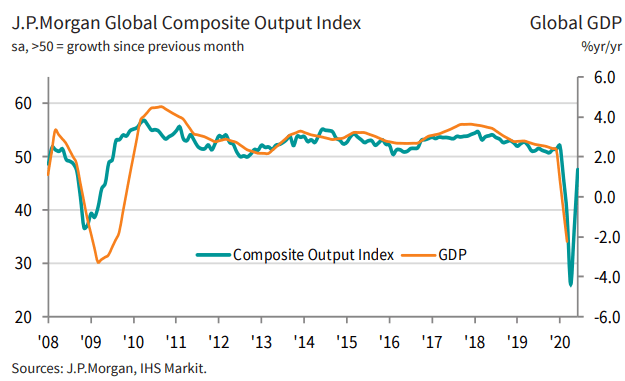
Chart and Data from Markit, JPMorgan

If you want to download my Manic-Crisis calendar, you can find the updated file here.
.


