


S&P 500, Dollar, AUDUSD Points:
- The threatening technical breakdowns for the likes of the S&P 500 and Nasdaq 100 didn’t carry over to the start of this new trading week
- Though there remains a wide divergence in risk positioning and traditional valuation, liquidity conditions this week on quarter-end and holiday trade may sustain complacency
- Top event risk ahead includes the Chinese June PMIs, Canadian and South African GDP figures and a US consumer sentiment survey
Not Ready to Commit to Panicked Selling
We ended this past trading week off with a serious fracture in the technical backdrop. There was a broad slip in risk-leaning assets that was prominently led by the technical progress registered by the S&P 500 and the Nasdaq 100. For the former, Friday brought a close below the closely watch 200-day moving average and the linear projection of a three-month rising trend channel support. For the tech-heavy index, the technical scrutiny was even more intense. A head-and-shoulders pattern break would register among those chart watchers that have also placed greater emphasis on the top performing sectors (in this case tech). Yet, as has been the case time and again these past months, technical breach does not automatically translate into committed trend. That remains the case heading into the new trading session as breaches have retraced into Tuesday trade. Committing to a full-tilt sentiment charge like systemic risk aversion is improbable, but so too is spinning a correction into a renewed bull trend. Set expectations appropriately.
| Change in | Longs | Shorts | OI |
| Daily | 1% | -1% | 0% |
| Weekly | 15% | -13% | -1% |
Chart of the S&P 500 with 50 and 200-Day Moving Average and COT Positioning (Daily Chart)
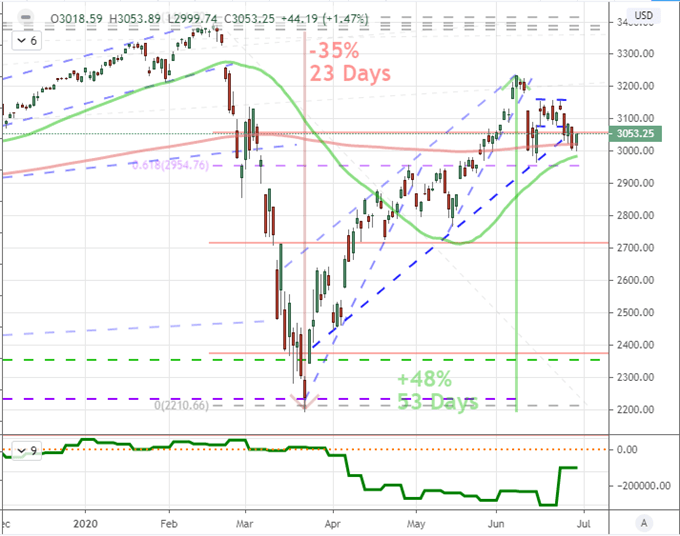
Chart Created on Tradingview Platform
While risk trends have refused to recalibrate to traditional measures of yield-to-risk, the disparity is one that seems clear to even the most bullish holdouts in the broader markets. As the saying goes: ‘markets can remain irrational longer than you can remain solvent’ (or something approximate to that), which practically reflects on the recognition that value is in the eye of the collective beholder. If markets want to place their faith in central banks or momentum itself, it is not worthwhile to actively fight the trend in my view. Then again, recognizing this distortion and awaiting the return to rational thinking can be a point of patience that is rewarding. Below, I have pit the S&P 500 against a rudimentary measure of risk/reward combining the US 10-year Treasury yield relative to the VIX volatility index.
Chart of the S&P 500 Overlaid with Ratio of US 10-Year Yield to VIX Index (Monthly Chart)
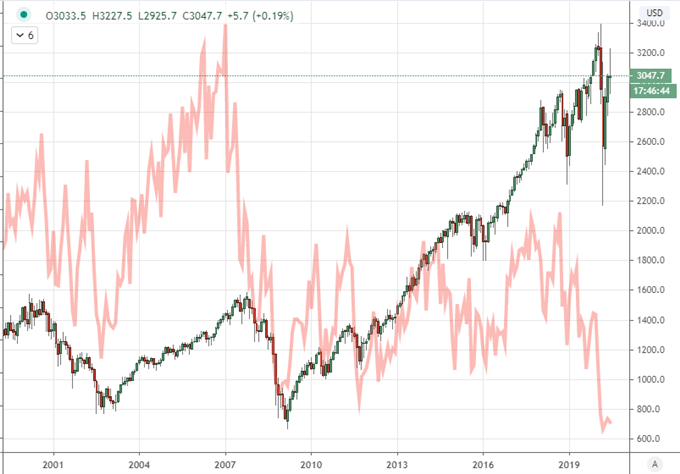
Chart Created on Tradingview Platform
The Systemic Matters that Lurk Over Our Markets
While key fundamental and systemic matters may not be driving a clear and consistent market trend at present, the potential should not discounted for mere convenience’s sake. If there is a matter that stands out above all others at the moment for me, it is the threat posed by the resurgence in the pandemic. Through this weekend, the cases of global infection surpassed the 10 million-mark while the number who have perished from the virus has passed a staggering 500,000. These are extraordinary numbers and present a serious concern that the global epidemic is entering a new phase. How reassuring can markets that are pressing new record highs truly be with this kind of backdrop?
Graph of Worldwide Cases of Coronavirus (Daily)
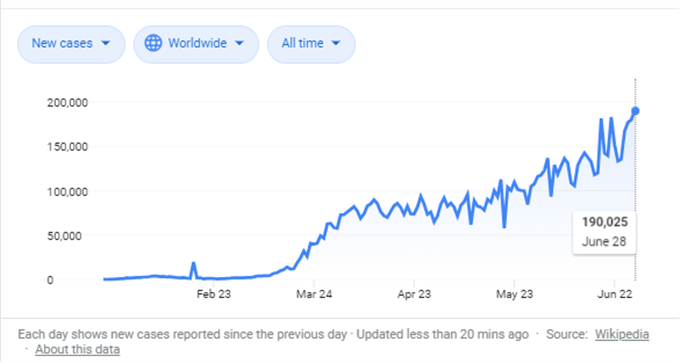
Chart from Google with Data from Wikipedia
A more traditional distortion of the global market space is the seasonal liquidity swoon out of the United States Though we have four full days of trading out of the New York session, Friday’s observation of the Fourth of July holiday pulls at attention like a gravity field. History suggests this particular week of the year can struggle to facilitate critical technical decision making, but I will not fully discount the technical cues that develop through the period. There is so much tension built into these markets that an unexpected move can readily turn into a full catalyst.
Chart of S&P 500 with Volume and Highlights on Fourth of July Weeks (Weekly)
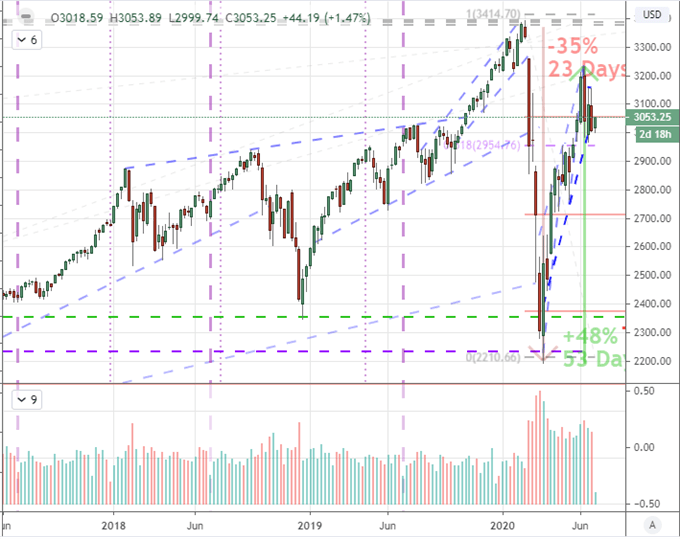
Chart Created on Tradingview Platform
High Profile Event Risk and Their Representatives
This past session was particularly light on critical event risk. On the docket through the first 24 hours of trade this week, the Chinese industrial profits (-19.3 percent year over year through May) and Eurozone economic sentiment (75.7 versus 80.0 expected) were the two material standouts in my book. Neither proved particularly market moving. For the Euro, news that the high German court had shifted the ruling on ECB stimulus overstepping its bounds onto the Bundesbank seemed to offer some measure of relief with a notable rally for the likes of EURJPY, EURGBP and EURCHF. I am watching the situation in China more closely for now with the NBS June PMIs on tap. Yet, instead of USDCNH, my preferred representative to the event risk is AUDUSD which has carved out its smallest four-day range sine volatility kicked off in February.
| Change in | Longs | Shorts | OI |
| Daily | 2% | 3% | 2% |
| Weekly | 29% | -46% | 0% |
Chart of AUDUSD with 50-Day Moving Average and 4-Day ATR (Daily)
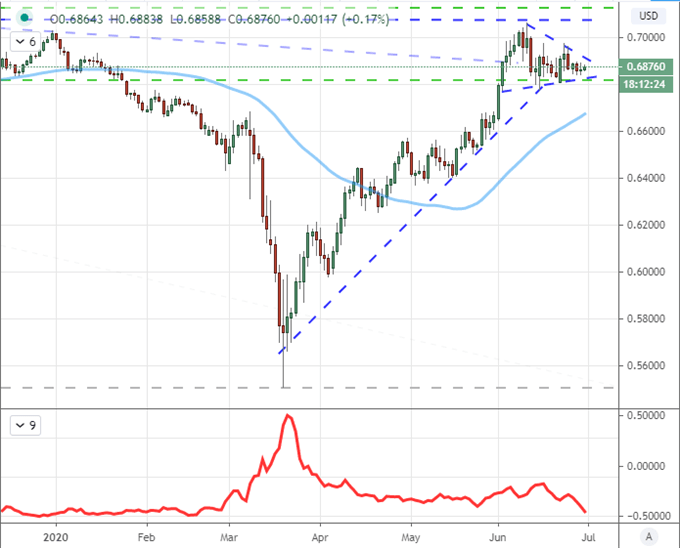
Chart Created on Tradingview Platform
From the docket ahead, I give credit to the Chinese PMIs, the South African 1Q GDP update and Canadian April growth figure. However, for heft when it comes to tapping deeper themes, my real interest is in the US Conference Board’s consumer sentiment survey. This report will reflect upon consumer labor perspective, intention to consume, views on the market and leanings in political support. These are all loaded matters in our markets today. I will point out that the Dollar is particularly exposed, but look at EURUSD versus the majors when determining the route to take. A comparison of the trade-weighted DXY index relative to my equally-weighted majors index presents a very different lean.
Chart of Trade-Weighted DXY Dollar Index and Equally-Weighted Dollar Index (Daily)
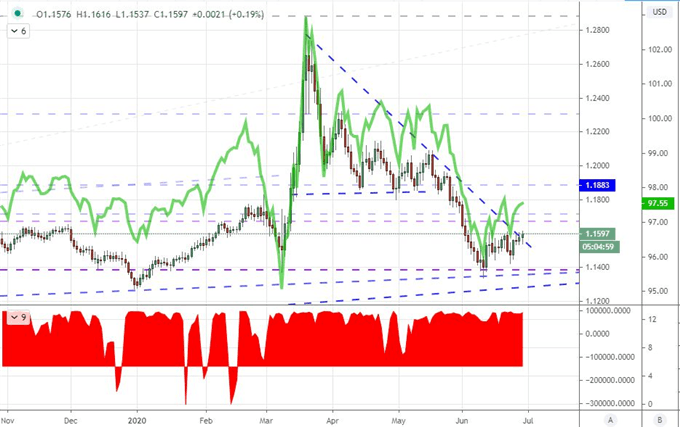
Chart Created on Tradingview Platform

If you want to download my Manic-Crisis calendar, you can find the updated file here.
.


