


US Dollar, AUDUSD, AUDJPY, Nasdaq Talking Points:
- Thought he Nasdaq is within easy reach of its record high, other ‘risk’ benchmarks are showing a faster pace of climb – perhaps related to protests and other localized concerns
- The DXY Dollar Index dropped for a 6th consecutive session Tuesday, the longest stretch since 2007 as relative growth, yield and stability issues take hold
- Ahead, key event risk in the US ISM services and ADP payroll will hit themes like GDP; but the Aussie GDP and BOC decision will nudge motivated Aussie and Loonie moves
Risk Appetite Continues its Charge but Changes Leaders
There is an unmistakable bias showing through in across the financial system. Unless the systemic pressure is escalating in a material way, it seems the rank and file is comfortable with falling back on speculative appetite and push standard bearers ever higher. The recession we are currently wading through is severe and the recovery is hardly inspiring a V-shaped about face. Meanwhile, the US-China trade war is still on a path of escalation and the timing of a vaccine for the coronavirus is starting to come in more clearly as a potential detriment for a hastened global economic reopening. For the US indices, the S&P 500 is less than 10 percent away from record highs after Tuesday’s climb. The more impressive standing comes from the Nasdaq 100 which is now approximately 0.8 percent away from the February record high.
Chart of Nasdaq 100 Index with 20 and 200-Day Moving Average (Daily Chart)
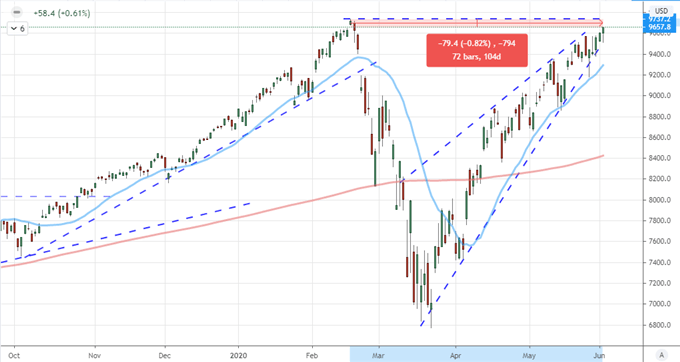
Chart Created on Tradingview Platform
What marks our situation as one of not simply an isolated regional or asset type appetite is the breadth of speculative appetite. Key global indices have extended their run from relatively deeper retreats from the German DAX to Japan’s Nikkei 225. The emerging market assets have advanced from the EEM ETF to key currencies such as the Mexican Peso and South African Rand. The ‘front run the Fed’ trade of junk bond ETFs (HYG and JNK) is also enjoying the climb. The most remarkable performance among the milestones I usually refer of late seems to be the Yen crosses. If USDJPY is able to override the Dollar’s remarkable weakness to gains, there must be a particular affinity to sentiment and robustness to the sentiment. That said, if you are watching the Yen risk measures, there are many crosses that should be considered. EURJPY, AUDJPY, CADJPY and others have remarkable technical benchmarks in view and already breached.
Chart of EURJPY and 20-Day and 200-Day Moving Averages as Well as Consecutive Candles (Daily)
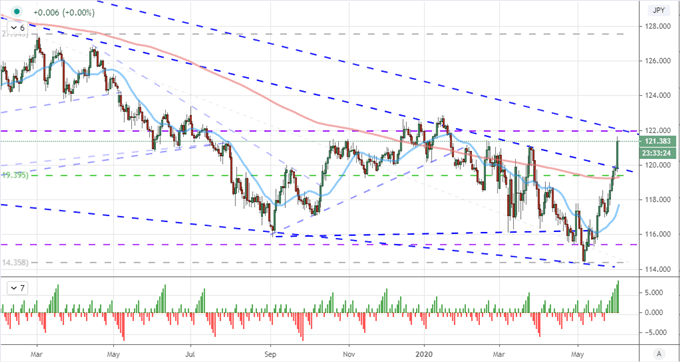
Chart Created on Tradingview Platform
The Relative SPX and Dollar May Signal Protests Distorting Risk
Back to the USDJPY, it was remarkable that this pair managed meaningful gain his past session given that it has essentially floundered the past week. With risk trends aiming higher, there must have been a material bearish pressure on the Greenback to offset the innate buoyancy. Indeed the benchmark US Dollar has been under serious pressure this past week. Through Tuesday, the DXY Dollar Index has dropped six consecutive trading days – matching the longest such stretch back since the last 7-day move in October 2007. Is this weakness a reflection of an unloved safe haven or perhaps growing stimulus expectations? For the former, this currency hasn’t played close to the reserve role and neither Fed Fund futures nor Treasuries are pricing in anything more experimental. I think this could be a measurable global withdrawal from US markets for the cumulative effects of a withdrawal from global trade (trade wars), a faltering fiscal stimulus support and growing discord in the nation in the wake of the protests of George Floyd’s death in police custody. With the Presidential election in November and a firm economic recovery unlikely by that time, more divisive policy could be on the way.
Chart of S&P 500 to VEU ‘Rest of World’ Equity ETF Ratio with DXY Dollar Index (Daily)
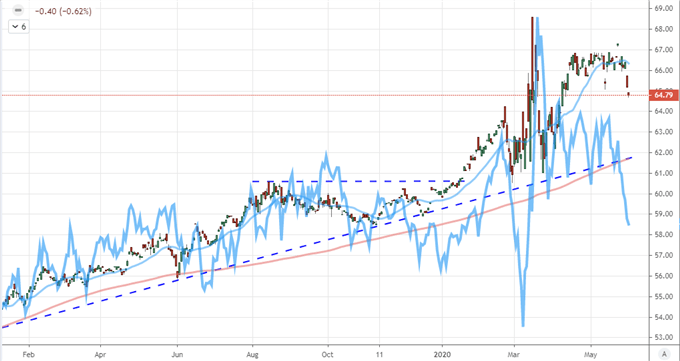
Chart Created on Tradingview Platform
Whatever the genesis of the Dollar’s bearish pressure, it is a broad sentiment. The slide is measurable against most counterparts. Yet, in selecting pairs to monitor, there are some benchmarks that I like to use as indicators rather than their own vehicles. EURUSD is the heaviest weighted component of the DXY Index and looks like mirror of the composite. USDJPY is a better measure of what is the most influential wind; Dollar performance or risk trends. At present, if you want a measure that is a little more heavily weighted towards the Greenback, GBPUSD seems a candidate as the post-Brexit trade negotiations are currently a secondary concern – though that may not always be the case. Technically, the proximity of the 100-day moving average and alignment of the 200-day average to range resistance is hard to miss.
| Change in | Longs | Shorts | OI |
| Daily | 3% | -7% | -3% |
| Weekly | 4% | -10% | -5% |
Chart of GBPUSD with 100 and 200-Day Moving Averages (Daily)
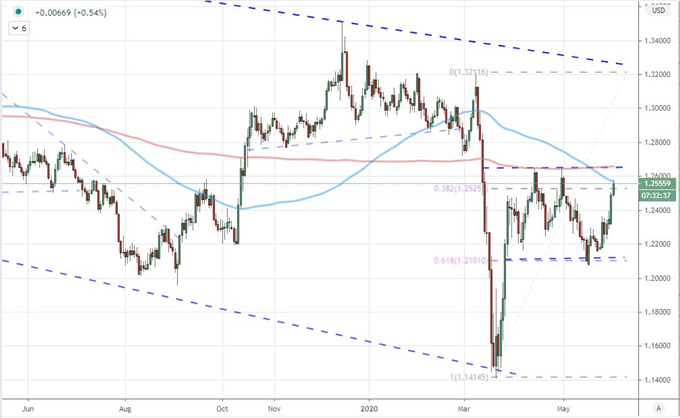
Chart Created on Tradingview Platform
Top Scheduled Event Risk Ahead: US Services Activity; Australian GDP and BOC Decision
While I believe the Dollar is one of the most put-upon majors in the FX market – to considerable effect in momentum – it is difficult to believe this drive can sustain itself in a broad market that is very light on true trends. It is possible, but statistically look improbable to sustain given surrounding conditions. Yet, a bearing can continue if fresh fundamental charge comes down the line. From the US docket, the ADP private payrolls for May will pre-empt a closely watched Friday NFPs. The top listing on my docket though is the ISM service sector activity report for May which is a good historical proxy to GDP. If you are looking for an amplifier through a cross, the Australian Dollar is one of the most consistent offerings of key event risk this week. The RBA rejected negative rates yesterday and eased up their fears over the worst of the recession, but the 1Q Australian GDP release will offer something tangible today.

Chart of AUDUSD with 20-Day and 200-Day Moving Average (Daily)
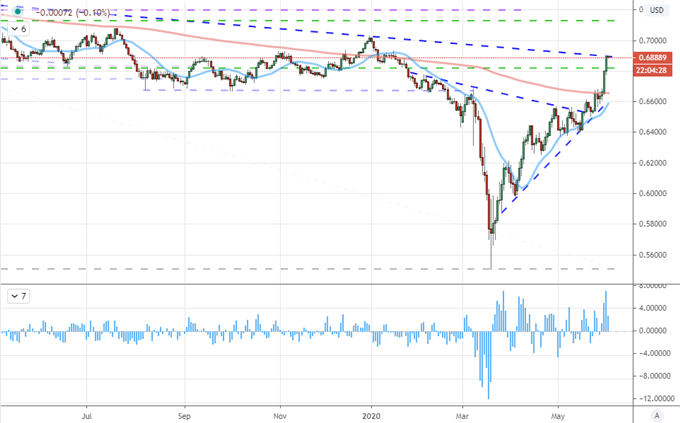
Chart Created on Tradingview Platform
Another cross of merit for cross-fundamental influence will be the Canadian Dollar. After a slow start to a range and 50 percent Fib (not a real Fib) break below 1.3800 a week ago, it has been a slow bearish progress…until this week. The tumble through the 100-day moving average has brought us down to 1.3500 and the 200-day moving average as next support. A Bank of Canada decision that echoes the RBA could be enough to give another jolt of enthusiasm.
| Change in | Longs | Shorts | OI |
| Daily | -2% | 7% | 5% |
| Weekly | -30% | 38% | 13% |
Chart of USDCAD with 100-Day and 200-Day Moving Averages (Daily)
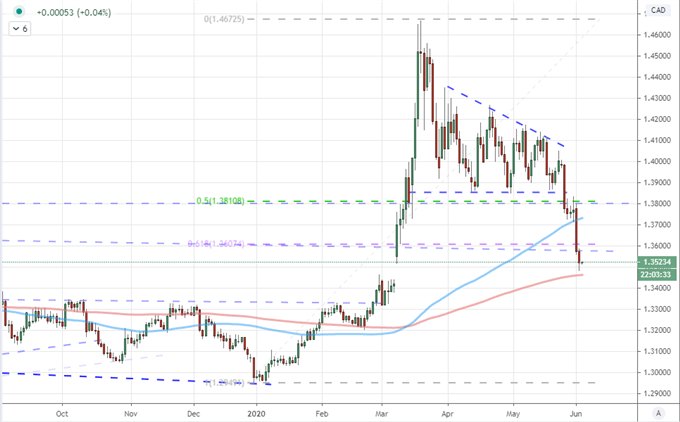
Chart Created on Tradingview Platform

If you want to download my Manic-Crisis calendar, you can find the updated file here.
.


