


Dow and DollarTalking Points:
- The US markets were closed Monday for the Martin Luther King Jr holiday and the drain in liquidity was felt across the globe
- Top event risk through Monday was the IMF's updated World Economic Outlook with a further downgrade in its forecasts
- Event risk ahead includes a BOJ decision and US-France trade deadline, but also mind the status of speculative expectations
Liquidity Helps to Dampen Concern Over the State of the Global Economy
We opened this past trading week to a known drain on liquidity. Market Luther King Jr Day in the United States is a market holiday, which tends to compound the fact that it follows a weekend so far as its ability to curb speculative momentum in other corners of the financial sea. Looking to the risk-leaning markets that were open this past session, it was clear that there wasn’t going to be an effort made to fuel the tentative moves that have started to take traction: such as the attempted break for the DAX or FTSE 100 indices, USDJPY and other yen crosses, or emerging market currencies like USDMXN. We may be able to pick up where we left off coming Tuesday; but by then, we will have to take fundamental developments under closer advisement rather than just let momentum ride.
Chart of FTSE 100 CFD (Daily)
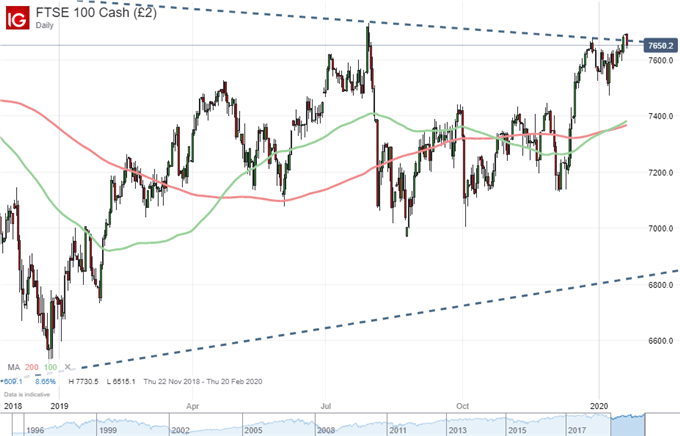
Chart Created with IG Trading Platform
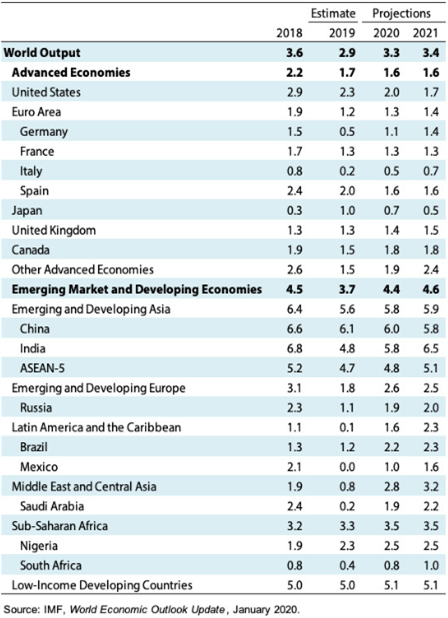
For fundamental influence, Monday had a few notable updates. However, the few economic data releases on tap weren’t really of the sort that can trigger speculative intent with so much high-profile event risk just ahead. The stand out was the reference to global growth conditions. The more prominent update came from the IMF’s most recent World Economic Outlook (WEO) update which further lowered its outlook for growth around the world. The global economy is estimated to have grown only 3.6 percent this past year while the 2020 outlook was lowered by a tick – or 0.1 percentage point – to 3.3 percent while the 2021 forecast was hit by two ticks for a 3.4 percent pace. Much of the revision was reportedly coming from India as well as a dependency on emerging market economies that were already stretched. Despite this lackluster situation, the group struck a positive tone suggesting the ‘bottom’ may be in. On the US-China Phase 1 trade deal, they estimated it may only cut growth by 0.5 percentage points rather than 0.8 percentage points anticipated before the agreement.
Global Growth Forecast Table from IMF
Trade Wars and Monetary Policy Back on Tap Starting Tomorrow
Along with the return of liquidity Tuesday, we are also looking at a meaningful pick up in scheduled event risk. Two events among the broad listings that will stir more systemic waters are the Bank of Japan (BOJ) rate decision and US-France trade negotiations deadline. The Japanese central bank does not offer a specific time for its announcements, but it is unlikely to alter its mix of essentially-zero benchmark and the steady QE infusions targeting a 10-year government bond yield. The real risk here is the potential that the market starts to extrapolate the shortcoming of this group’s influence to be a problem for all monetary policy. Though there is growth and some measure of yield to be found in the open market, it would be fanciful to write off the influence that major central banks have had in encouraging risk taking.
Chart of S&P 500 Overlaid with the Three-Month Rate of Change in Fed Balance Sheet (Weekly)
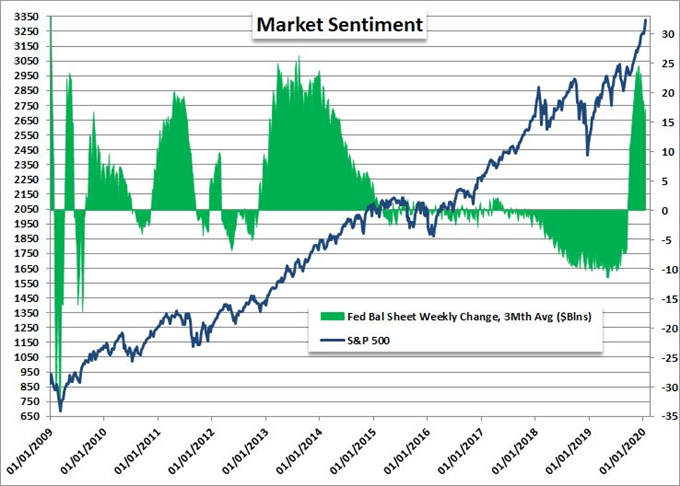
Chart Made by John Kicklighter with Data from Bloomberg
On the trade war front, the US-China Phase 1 trade deal ink is still drying, but the favorable winds from this agreement were tamed before the two sides even met. USDCNH is still heading lower, but the often-talked about resurgence in global risk trends following the break through seems still in the making. The Senate vote on the USMCA didn’t even show up on the radar. USDCAD is still tracking out a remarkably controlled range while USDMXN is tempting a multi-year breakdown but the spark doesn’t seem to be catching. Perhaps an update on trade relations between the US and Europe will offer another prod to a complicated global picture. The Washington and Paris set a deadline of January 21st to reach an agreement on the digital tax the latter raised on large tech companies. In the balance is a $2.4 billion retaliation by the US while the $7.5 billion in tariffs to counter Airbus subsidies is shaping the backdrop. I will watch EURUSD for positive or negative reaction to any developments.
Chart of EURUSD with 100-Day Moving Average (Daily)
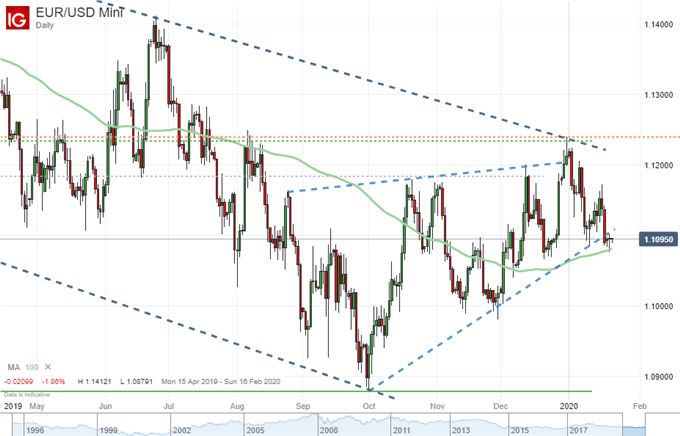
Chart Created with IG Trading Platform
Extreme Speculative Futures Positioning Figures to Watch
While the fundamental waters begin to boil, I’m keeping close tabs on the speculative view setting expectations. With a few markets stretched over short, medium or long-term lookback while others test the bounds of ranges, we are finding the market is starting to position with a view as to the outcome. Speculative positioning behind the Dollar has been collectively dropping fast, but the GBPUSD is one of the most interesting picture over just the past months. Net speculative futures positioning has swung aggressively from net short to net long around Brexit deadlines and the general election. There is still a favorable fundamental trajectory, but the rapid charge just this past month suggests exuberance.
| Change in | Longs | Shorts | OI |
| Daily | 3% | -7% | -3% |
| Weekly | 4% | -10% | -5% |
Chart of GBPUSD and Net Speculative Futures Positioning from CFTC (Weekly)
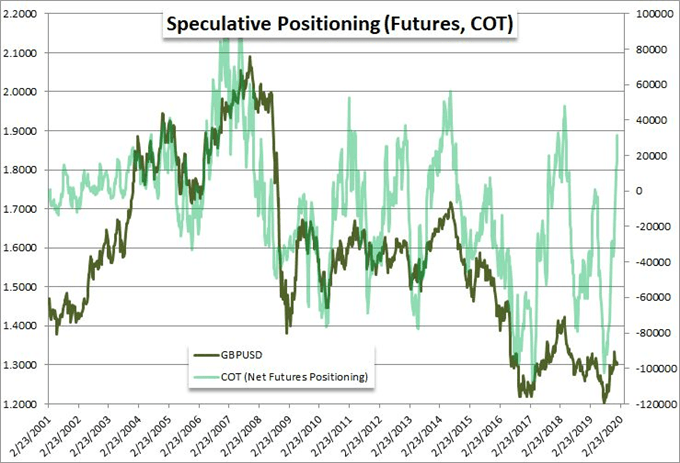
Chart Made by John Kicklighter with Data from Bloomberg
Where the Cable’s speculative swing has been more exaggerated in the short-term, the USDMXN positioning has found more remarkable momentum over a longer period. The pairs has spilled over the floor of a multi-year wedge/triangle formation not long ago, but the break has not catalyzed into the follow through some may have expected. Consider speculative futures traders have pushed their net exposure to the heaviest short view on the pair on record and it gives a sense of the anticipation that seems to be building behind the scenes.
Chart of USDMXN and Net Speculative Futures Positioning from CFTC (Weekly)
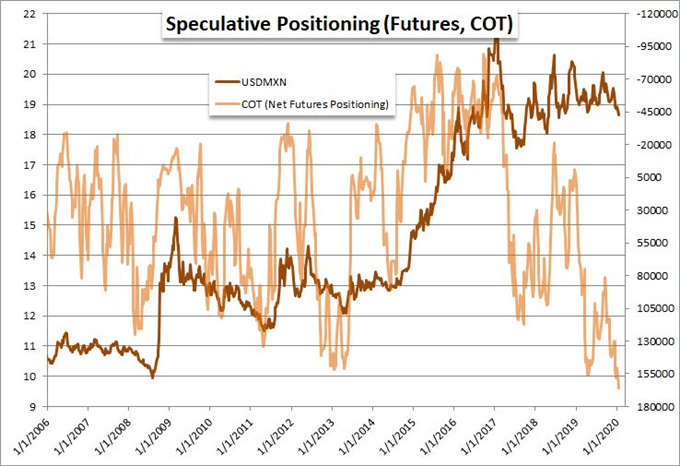
Chart Made by John Kicklighter with Data from Bloomberg
Last but not least is the relentlessness of gold. Both the commodity itself in holding six year highs and net speculative positioning in futures holding near record net long exposure suggests there is perhaps more concern of the global financial system through safe haven demand or demand for an alternative to traditional fiat than ‘normal’ market measures may indicate. I keep coming back to this asset as a complement to my assessment of risk trends and liquidity confidence. I will continue to do so.
| Change in | Longs | Shorts | OI |
| Daily | 1% | -3% | -1% |
| Weekly | 2% | -8% | -2% |
Chart of Gold Price and Net Speculative Futures Positioning from CFTC (Weekly)
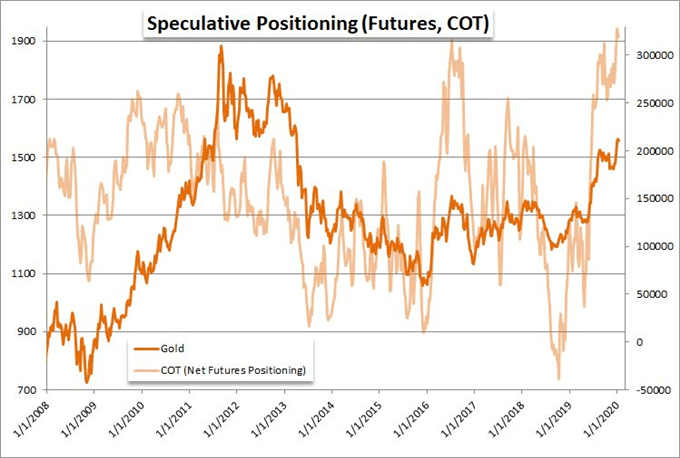
Chart Made by John Kicklighter with Data from Bloomberg
If you want to download my Manic-Crisis calendar, you can find the updated file here.
.


