


BrexitTalking Points:
- US officials are ramping up the trade war progress rhetoric, but neither the Dow nor other risk benchmarks found much lift from it
- British Pound faces yet another critical vote, but Friday's 14:30 GMT withdrawal agreement vote actually carries some weight
- Gold posted its second biggest drop since August while Crude oil prices couldn't clear 58 despite a Trump tweet and Russia warning
See how retail traders are positioned in GBPUSD ahead of the MV3, Gold after its tumble, crude oil as it struggles to overtake 60 or 58 along with the rest of the FX majors and indices intradayusing the DailyFX speculative positioning data on the sentiment page.
Trade War Headlines are Improving and the S&P 500 is On Pace for its Best Quarter in a Decade
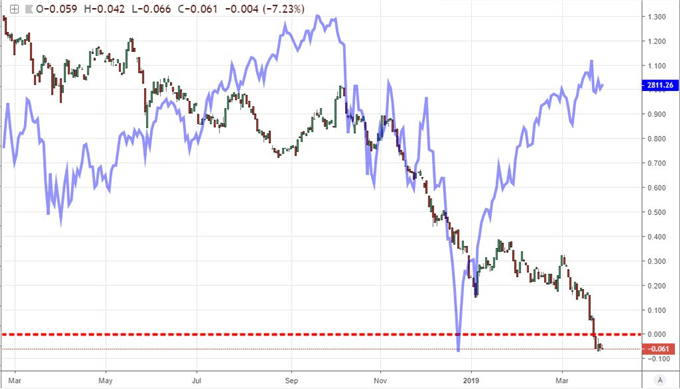
The fundamental drums continue to beat, but the markets are doing their best to tune them out - both discounting the risks implied as well as the support. On the monetary policy front, there was plenty of central banker speak these past 24 hours, but the optimism and vows of further tools to fight building crises was balanced by the recognition that conditions warranted extreme support. The general concern over the course of growth - recession fears more directly - was also struggling to gain traction. New York Fed President Williams weighed in on market's favorite threat assessment this week by suggesting he was watching the Treasury yield curve inversion closely, but attempting to discount any fears, he said he does not see any elevated risk of recession in 2019 or 2020. If markets were looking for an overt motivator, they could have found it in trade war headlines. US officials were clearly attempting to spur some enthusiasm from the markets by reporting China was showing movement on key hurdles to a deal including forced technology transfers and allowances for foreign tech companies to own their own data centers for cloud computing.
If the market had a predisposed bullish or bearish bias, it could have cherry picked from these high-profile themes to justify its sentiment. Instead, the benchmarks for speculative appetite were holding their critical boundaries. The Dow and S&P 500 are perhaps the most closely watched of the measures, and their technical patterns couldn't better represent indecision these past weeks. Congestion patterns are holding firm as we look to close out the final trading day of the first quarter. If the S&P 500 holds up through Friday's close, it is on track for the best quarterly performance since the long bull trend began a decade ago. As remarkable as that may be, it is important not to draw too strict of assumptions from that correlation. This remarkable three-month performance we are closing out follows one of the worst slumps over a similar span (the fourth quarter) since the depths of the Great Financial Crisis in 2008. The reversal 10 years ago came after a significantly flush of excess speculative exposure and from a level where many would agree the financial system was in the depths of a deep discount. I think few would make such a similar claim of value now. With the implications of quarter-end 'window dressing' and an apparent comfort with putting off a critical decision on risk trends, traders should expect to reserve their calls of 'risk on' or 'risk off' until next week at earliest.
Chart of 10-Year-3-Month US Treasury Yield Spread and S&P 500 (Daily)
Sterling Posts Its Biggest Drop in Months Ahead of Brexit Vote, Watch the Dollar and Euro As Well
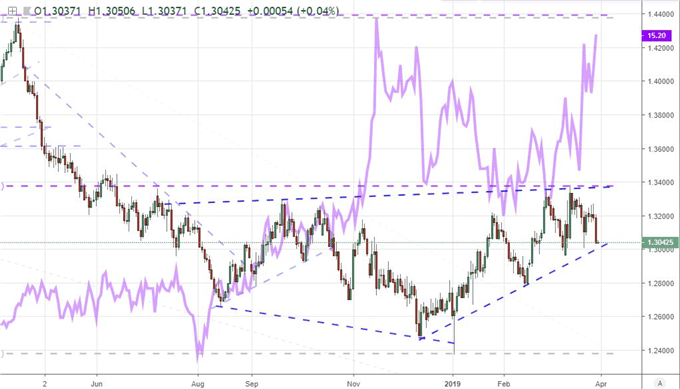
Amongst the majors, there is a particular currency that looks to be at risk of some late-in-the week fireworks Friday. Taking a look to the CME's Pound Volatility Index, we find anticipation of significant market movement over the medium term (this like many of its volatility measures is set to a month ahead). We index is pricing the possibility of the greatest swings from the currency since November. Of course, the source of these concerns is clear. Traders are focused on Brexit. Interestingly, this past session, GBPUSD suffered its largest single-day tumble since December 10th, remarkable considering we are actually between important votes. On Wednesday, we learned that Prime Minister Theresa May announced to her party that she could step down if the next phase of her Brexit plan were to pass and then Parliament went on to vote down 8 possible Brexit alternatives in indicative votes. As remarkable as that is, the outcome was generally expected. Ahead, we have another important vote that will hold greater consequence. Friday at 14:30 GMT, the outcome of Parliament's vote on PM May's Withdrawal Agreement is anticipated. Should it pass, the Sterling can finally stage the start of its recovery. If it fails - as is expected - the deadline will move up to April 12th. There is good potential for Pound volatility Friday, but there isn't much time to truly establish trend. For many - myself included - it is better to await the return of liquidity Monday to make a call.
While there are local fundamental considerations for the only two currencies with deeper liquidity than the Sterling Friday, there is a high probability that both the Dollar and Euro find a more significant crosswind from this turbulent currency. The US Dollar continues to overlook the tumble in rate forecasts (now showing a high probability of a cut before year end according to Fed Fund futures) and growth concerns have found a modest foothold in the downgrade of the final reading of 4Q GDP (slowing from its 2.6 percent pace last month to 2.2 percent). Ahead, the PCE deflator on tap is the Fed's favored inflation indicator, but the concern over recession could put the focus on the component income and spending data. For the Euro, the German CPI pace slowed unexpectedly to a 1.3 percent clip while the Draghi's favored 5-year, 5-year swap inflation reading slowed to its most restricted pace since September 2016. Ahead we have the advanced EZ CPI reading for March. Yet, if the Sterling is sent reeling, the insinuated trouble for Europe will likely pull the Euro in its wake and lift the Dollar for its safe haven appeal. As always, establish what matters the most when evaluating fundamental motivations.
Chart of GBPUSD and CME’s Pound Volatility Index (Daily)
Heavy Headlines with Restrained Volatility for Oil, The Opposite for Gold
In an unusual turn, commodities were one of the more active asset classes this past session. While there were a few moves in the agricultural and industrial assets, there was far more activity for the favorite markets: gold and crude oil. From the precious metal, Thursday offered the biggest drop since March 1 - and the second biggest drop since mid-August. We could attribute this move to the US Dollar's steady climb of late, but that would mis-diagnose the motivation - and if you do that, you will struggle to keep tabs on the subsequent moves. If you look at gold priced in the Euro, Pound and Yen (or a mixture of all of these primary pricing currencies); you still see a significant drop from the commodity. Low volume in the futures market and the troubled landscape between over-extended central banks and uncooperative governments will keep gold always one step away from a meaningful rally as capital seeks an 'anti-fiat'. Even if you don't intend to trade this market, it is very important to watch its progress.
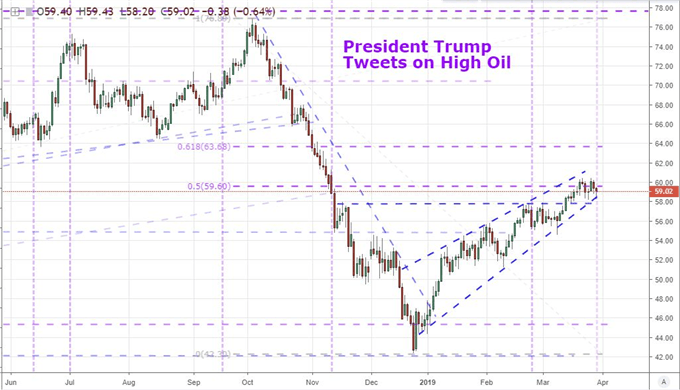
Where gold was suffering a steep loss on an unconvincing fundamental backdrop, crude oil was holding steady despite clear provocation. There were a few sparks that could have set the market off this past session. We have been talking about the probability that the US President Donald Trump would weigh in on the level of crude prices as it extends its first quarter advance slowly but steadily. He didn't disappoint, calling for OPEC to increase the flow of oil to curb high prices, 23 trading days after the last time he tweeted about high crude oil prices. Volatility followed in the wake of his offhanded comments, and Russia's suggestion that it would not extend its production curbs alongside OPEC added further supply-side weight to the market. That said, crude would not make a serious effort to drop below $58. We continue to trade out a restricted range with OPEC refusing to take Trump's requests seriously and global growth forecasts fading. Perhaps we need a clear shift in risk trends to decide this impasse. We discuss all of this and more in today's Trading Video.
Chart of US Crude Oil and Instances of President Trump Tweets (Daily)
If you want to download my Manic-Crisis calendar, you can find the updated file here.


