


Bear Market Talking Points:
- The S&P 500 recovered from its gap lower to start Wednesday, but its chart still looks like the progression of a systemic turn
- Context of speculative bias remains the most important feature of the market, but monitor flash points like growth and trade wars
- Dramatic morning moves from the Japanese Yen and Australian Dollar readily distract from hefty Dollar, Loonie and Pound trade
What are the DailyFX analysts' top trading ideas for 2019 and key lessons to take away from 2018? Sign up for bothon the DailyFX Trading Guides page.
A Different Start to the New Trading Year
The start to 2019 is unlike most other calendar year turnovers for the speculative markets in modern financial history. Instead of a slow and comfortable revival from hibernation, we are trying to find our way amid persistent volatility and the threat of a more systemic financial market collapse. Looking back to the turnover from 2017 to 2018 as a baseline for what we typically see from seasonality influences, the year-end period often sees a significant reduction in volatility and volume that pairs nicely to a speculative buoyancy taking advantage of the unusually staid conditions. When the new year turned over, the market would dive back into the themes that would motivate the speculative appetites to build up or unwind exposure and usher in the next leg for the financial system. What we have dealt with this past month is the exact opposite of what qualifies in these terms as 'normal'. Despite the naturally-deflated state of liquidity, there remained an extraordinary amount of volatility that produced outsized price moves. The S&P 500 as a benchmark suffered its worst annual performance in a decade through 2018 and the range was essentially set in just the final months of the year. Now, we have a market that is hyper-vigilant for threats entering a period that will restore liquidity with an unrelenting tide of fundamental issues. That doesn't guarantee markets will fall apart we wade into deeper conditions, but it will seriously increase that risk.
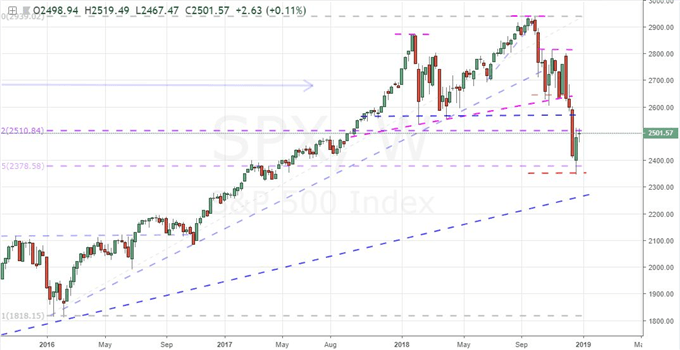
Chart of S&P 500 (Weekly)
The S&P 500 Solidifies and the Yen Explodes
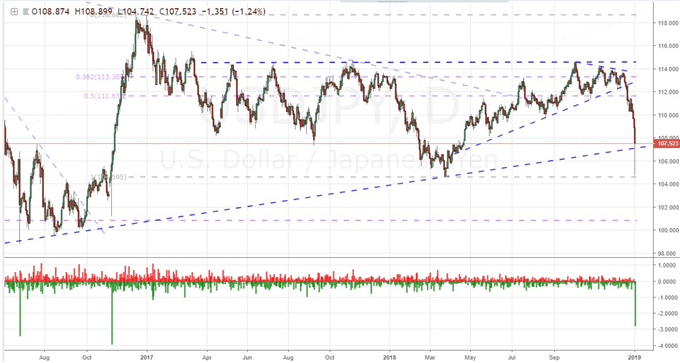
A good technical representation of the mentality that the markets face can be found in the S&P 500 - one of the most appropriate symbols of global speculative condition thanks to its role in guiding the financial system higher through the past decade with particular appetite for its derivatives as exposure to 'the market'. The index has stoked a meaningful recovery over the past week; but against the backdrop of the preceding months, it looks more likely a bid of desperation to delay a complete collapse than an earnest bid at a full-blown turn. The approximately-7 percent rebound from last week has swung the benchmark index from a technical bear trend (a 20 percent correction from recent highs) to semi-convincing recovery. Yet, the bounce thus far brings it back to 2,520 - one of the more prominent levels of support that gave way in the rapid breakdown through year's end. This still fits the bill of a progressive reversal that finds former critical support as a new and meaningful resistance. Yet, where the the equity index slowly and deliberately plots its course, we have other areas of the market that highlight the volatility underlying the market. Point-in-case is the Yen crosses Thursday morning. Already in retreat, the pairs saw a sudden, extreme tumble early in the new session’s trade which could readily qualify as a 'flash crash'. The carry-directed crosses were led by an incredible tumble of nearly 400 pips (3.6 percent) by USDJPY in less than 15 minutes. That is extreme. What was the spark for such an exceptional move? Apple downgraded its forecasts afterhours owing in large part to the ongoing trade wars between the United States and China. Add to that the ongoing US-China trade war, the contraction reported in Chinese manufacturing, deterioration of fiscal support globally, central bank efforts going off the rails and other top-line themes; and there is a disturbing abundance when it comes to investor fear.
Chart of USDJPY and Tails (Daily)
Dollar Notches a New High but Its Key Events are Still Ahead
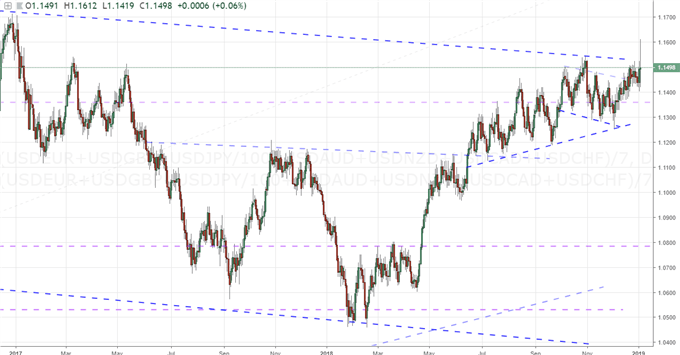
In these increasingly volatile times, traders naturally plot out their escape. Yet, the standard for what qualifies as a 'haven' has notably deteriorated. The Dollar is a principle representative of that evolution. As sharp as the losses for risk-leaning assets - such as US equities have been - the performance often falls far short of the intensity necessary to blot out all other means of evaluation that would make align otherwise complicated assets. The Greenback as measured by the trade-weighted DXY Dollar Index (largely EURUSD) posted its third largest single-day rally in six months - notable, but not particularly impressive when its relative high is still well-off November/December highs. That said, perhaps the restrictions are more heavily skewed towards EURUSD. When we balance out the weighting of the Greenback's performance, the currency's charge this past session actually pushes an equally-balanced measure for the currency to its highest intraday level since January 2017. This may not be a linear measure of the Dollar's role as a safe haven currency, but it is not likely a consideration of local fundamental concerns. The docket for the USD was light this past session. The upcoming 24 hour calendar has a few notables including the ISM service sector report (which is a good proxy for GDP) but that is not top tier for traders at the moment. The NFPs on Friday taps into the animalistic nature of the speculative rank, whether it is the familiarity of the headline number or the implications for rate speculation associated with wage growth that we are referring. Watch the US Dollar's bearing as this specific currency can act as a unique barometer to tell us which competing fundamental themes are more important than others at any given time.
Chart of Equally-Weighted Dollar Index (Daily)
Corrections and Trends for the Loonie, Crude Oil and Gold
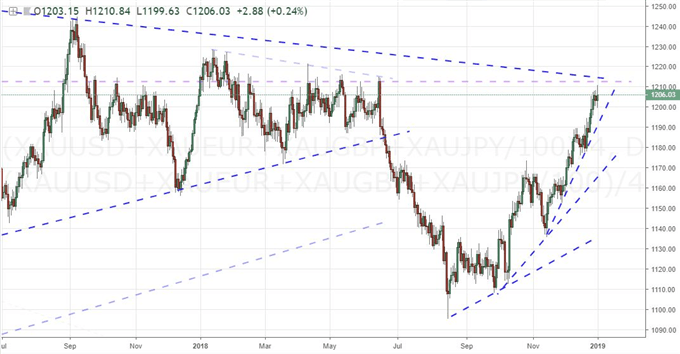
Outside of the fundamental complexity and gravity of the US Dollar, many corners of the market have proven more straightforward in their motivations. In FX markets, the Pound is clear on its focus with Brexit - though that comes with no explicit course. The Canadian Dollar is a little more nuanced but much more market moving. The currency posted its biggest single-day rally in three months on an equally-weighted index basis, but it remains in a prevailing bear trend on the bigger picture. Is this a US-trade, oil, trade wars, domestic growth basis? Price action isn't clear on that point, so neither is speculative focus. The Aussie Dollar's tumble Thursday morning is perhaps a little more straightforward. The timing of the AUD plunge aligns neatly with the Yen pairs and other explicit risk assets with a US-China trade war exposure. Aside from the FX market, commodities are blazing their own interesting trail. US crude oil attempted a strong rally Wednesday to make something of the inverse head-and-shoulders pattern bulls have fought for these past weeks. However, the turn could not be consummated with an upper wick that formed despite concern over OPEC's commitment to the 1.2 million barrels per day production cut that went into effect this week and is expected to last through mid-year. The supply-demand impact is priced in and now bulls are looking for further supply cut through the second half of 2019. Alternatively, gold is following risk trends more explicitly. The safe haven continues its slow climb on normal accounts. However, de-emphasize the weight of Gold-to-US-Dollars and the performance of the commodity looks much different. We discuss all of this and more to start this new year in today's trading video.
Chart of Equally-Weighted Gold Index (Daily)
If you want to download my Manic-Crisis calendar, you can find the updated file here.


