


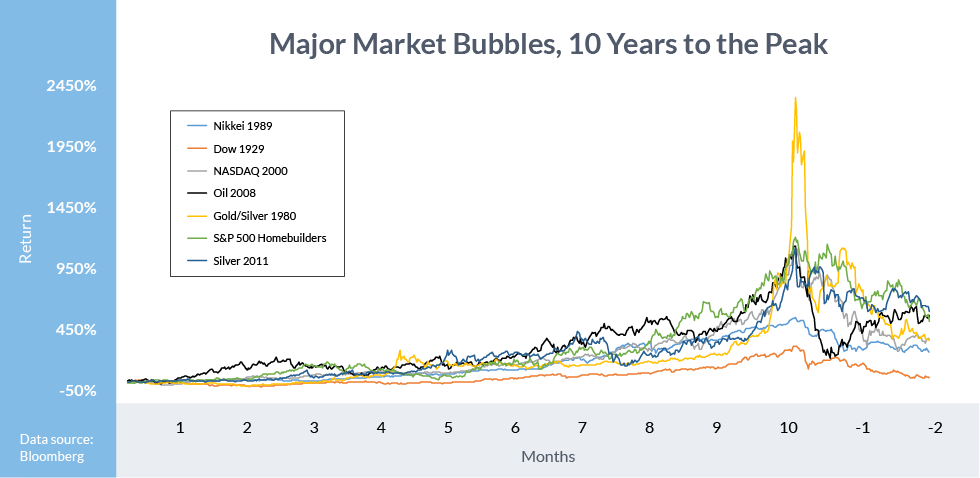
Throughout history, there have been numerous speculative economic bubbles and manias. Some were relatively isolated events which held limited or no broad economic ramifications, while others resulted in a full-blown financial crisis or marked the end of important eras.
In more recent times, flash-crashes have become another unusual but very different type of short-term threat to the marketplace as an unintended consequence of rapidly growing dependence on technology and algorithmic trading. We’ve put together a brief history of bubbles and manias and how they impacted the trading landscape.
Get your summary of the history of financial bubbles, crises and flash-crashes here.
Financial Bubbles Explained
“Bubble: a period of rapid expansion and price increases, followed by a market slowdown and contraction.”
- The Complete Real Estate Encyclopedia by Denise L. Evans, JD & O. William Evans, JD. Copyright © 2007 by The McGraw-Hill Companies, Inc.
Bubbles and manias have been around since the birth of financial markets, and as long as human nature remains the same these episodes of severe market dislocations will continue to develop and unravel as they have in the past, over and over.
The Tulip and Bitcoin bubbles are two of the more unusual occurrences given the type of ‘asset’ they are (were) and sheer magnitude of price appreciation. But along the way, between the days of Tulips and Bitcoin, there have been many instances of speculative bubbles and manias, some of whichended very badly for the broader financial markets and economy.
Flash-Crashes Explained
“Flash crash: an extremely rapid decline in the price of one or more commodities or securities, typically one caused by automated trading.”
- Lexico, by Oxford
With market participants relying more and more on technology in the last 20 years or so, and the popularity of quantitative and algorithmic trading growing exponentially, flash-crashes have become a threat to financial market stability.
Even though technology and the people behind it take the blame, there is one commonality between the following examples of major flash-crashes – market duress. Not necessarily major duress, but enough that a significant imbalance can occur in the vacuum of a liquidity.
A bevy of orders from one side of the market comes in and simultaneously the other side effectively steps away and just like that you have a major air pocket. These air pockets, or liquidity vacuums, result in a sudden spike in price. And while they are only temporary the financial impact can be enormous for those caught in these unforeseen events.
Financial Crises Explained
“Financial crisis: a powerful fundamental change or series of events accompanied by a large loss of value in one or more financial markets. The fall-out is often far-reaching and has significant ramifications for the underlying economy.”
- Paul Robinson, DailyFX
Some financial crises occur after a major bubble as speculative excesses are purged and the deflation phase of the cycle gains momentum, while others develop after prolonged periods of economic and financial market stress. It is worth noting that oftentimes there is a contagion effect that impacts the markets and economies most closely linked to the original source of the crisis.
An example of what could set off a crisis would be a steep stock market decline to the extent that confidence in the stability of the financial system is seriously eroded, ending in panic and drastic changes to monetary policy. Another example is a currency crisis, where a large currency devaluation leads to a severe disruption in capital flows and a significant weakness in the economy.
Historical Crashes, Bubbles and Financial Crises [Timeline]
In this article, we have included both ‘normal’ market bubbles – those which involved major commodities and major stock indices – and ‘abnormal’ market bubbles, involving niche markets with limited to no macro-impact. Here, the importance of the asset class to broader financial markets is the dividing factor.

1637: Dutch Tulip Mania
The history of bubbles begins in the 17th century. The first recorded market bubble – the Tulip mania – dates all the way back to 1636-1637, and yet after nearly 400 years we find ourselves today amidst a similar situation – the deflating of the Bitcoin bubble that reached its crest in December 2017.
“Of all the historical bubbles, only Bitcoin’s final blow-off stage rivaled that of the one seen during the Tulip bubble, and in total from the beginning to the end only Bitcoin has exceeded it.”
At the peak of the tulip mania, some single tulip bulbs – especially the coveted Semper Augustus – sold for more than 10 times the annual income of a skilled craftworker. It was only a matter of time before most speculators could not even afford the cheapest bulbs anymore, and the market collapsed overnight, resulting in serious debts for many.
Indeed, this is perfect example of how human nature in the marketplace remains unchanged despite all the advances in technology and availability of education and information to market participants. The asset type and reason behind the spectacular rise and fall are different, but the irrational behavior of market participants is nearly identical.

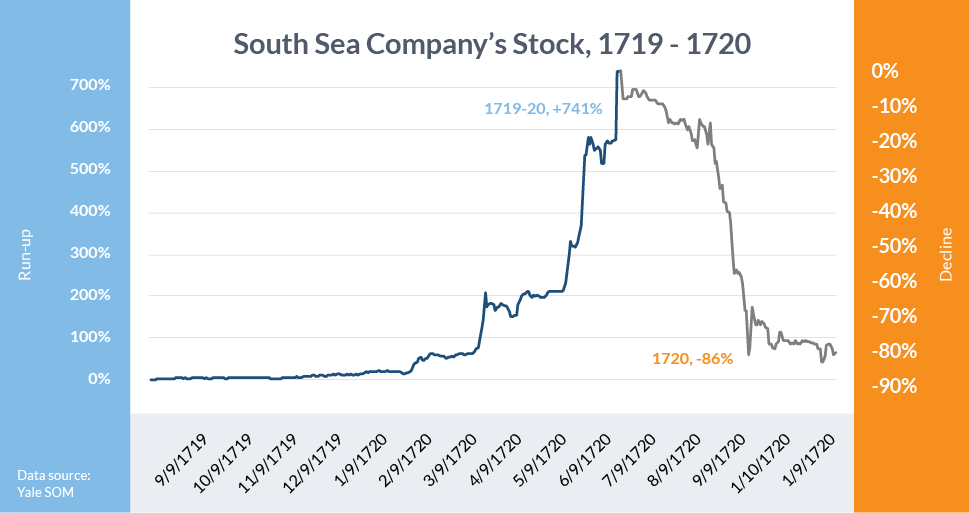
1720: South Sea Bubble
The South Sea Company’s stock was one of several shipping companies in the early 1700s to attract massive amounts of investor capital. Another famous bubble in this sector took shape in shares of Mississippi Company. The South Sea bubble saw over a 700% increase in its price in just six months, and from its peak in July 1720 the price declined by over 90% in only three months.
After the price of the South Sea Company’s stock crashed, the British government was forced to undertake a bailout. The debt? Several million pounds that, three centuries later, Britons are still paying interest on as a small part of that obligation.
1929: Wall Street Crash
The first major developed-world bull market that led to excessive speculation and extreme valuations took place during the ‘roaring ‘20s’ and culminated in the Wall Street crash of 1929. While the gains during the decade leading up to the top were relatively tame by comparison to other major speculative bubbles, the fall-out was tremendous with the Dow Jones losing 89% from the top on September 3, 1929 to the trough on July 7, 1932.
Along with the collapse of stock prices came the ‘Great Depression’, a recession which lasted over three and a half years and saw unemployment spike to nearly 25% in the US.

1980: Silver and Gold Price Bubble
In what was one of the largest manipulations in market history, the Hunt brothers, sons of oil tycoon H.L. Hunt, attempted to corner the silver market. This helped drive the price of silver to a peak of $49.45 on January 18, 1980 from approximately $6 just a year earlier.
In less dramatic fashion, during the same time-frame, gold prices rose from about $225 per ounce to a high of $843 on January 21, 1980. It’s worth noting, though, that gold rose a staggering 2300% over the 10 years leading up to the top.
Silver
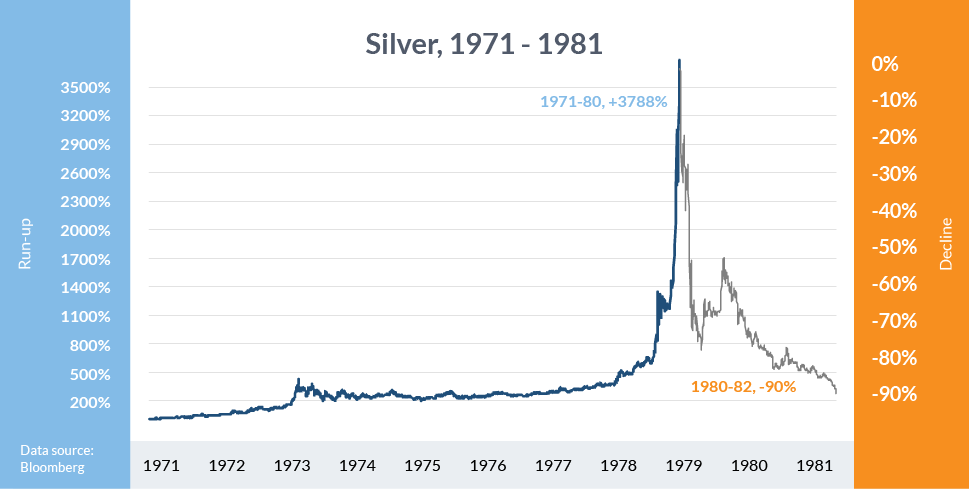
The fallout was significant.By the middle of 1982 silver declined all the way down to under $5, or 90% from the top, while gold traded to under $300, or -64% from the peak. While there weren’t any significant negative macroeconomic ramifications, the top in precious metals came at the end of the ‘70s spike in inflation and interest rates which haven’t been seen since.
Gold

View our gold price chart for an up-to-date overview of the current gold prices.
1989: Nikkei Stock Market Crash
Japan’s real estate and stock market bubble led to one of the greatest stock market crashes of all time. The Nikkei stock market crash made history not only due to its sheer size, but because the Japanese market has failed to trade back anywhere near the record high since. The Nikkei topped on December 29, 1989 and lost 63% until August 1992 before stabilizing for a few years. From top to bottom, however, the index lost nearly 82% from 1989 to its eventual bottom which came in 2009 on the heels of the Great Financial Crisis.
In the wake of Japan’s stock market crash, the country’s economy suffered several recessions. Real estate valuations which were also driven to unsustainable heights during the boom plummeted as well. The fallout eventually led to the Bank of Japan adopting a 0% interest rate policy in the late 90s and the development of quantitative easing – a policy which has largely been in place since.

See how the Nikkei is doing now in our JPN225 live chart.
2000: NASDAQ/Dot Com Bubble
The 1982-2000 bull market in the U.S. culminated with technology and internet stocks spiraling upward during the back-half of the ‘90s. The NASDAQ rose from 743 in the beginning of 1995 to a height of 5048 on March 10, 2000. In manic-like fashion the index more than doubled during the final six months.
When the Dot Com bubble eventually burst in September 2002, 78% of its value was wiped away, and most shares of internet companies saw their prices plummet by 95% or more (out of business). The then technology-heavy S&P 500 was cut nearly in half. The economy fell into a recession during 2001 after experiencing the longest run of growth in U.S. history, spanning 10 years.

Stay up-to-date with the movements of the NASDAQ with the DailyFX live chart.
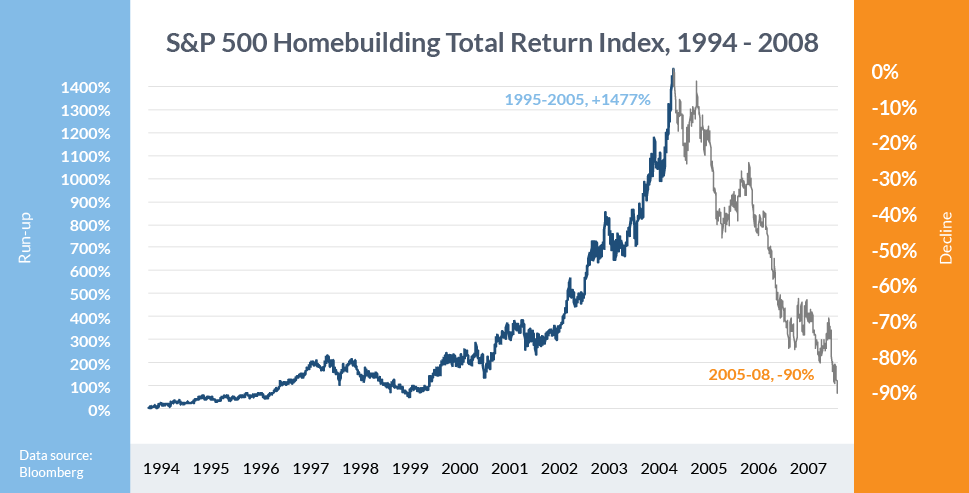
2007: US Housing Market Crash
The housing market bubble began in the ‘90s, but really took the baton from technology and internet stocks after the stock market top of 2000. Real estate prices and the valuations of homebuilders continued to rise as low interest rates fueled speculation in the real estate market.
"The bubble seen in homebuilding stocks isn’t a direct reflection but rather a proxy for what was taking shape in the property market from the mid-90s up until the peak was reached.”
The S&P 500 Homebuilding Total Return Index eventually fell by 90% from its peak in July 2005 to its trough in November 2008. It’s worth noting that the top in this sector came over two years before the top in the stock market, and in the end the bear market which began in housing forewarned the dangers which laid ahead for the broader economy and stock market.
Homebuilding stocks as a whole lost nearly 70% by late 2007 before the stock market topped. The result of the stock and housing market crash was the worst financial calamity since the Great Depression, earning the period from 2008 to 2009 the title of ‘The Great Financial Crisis’ (GFC).
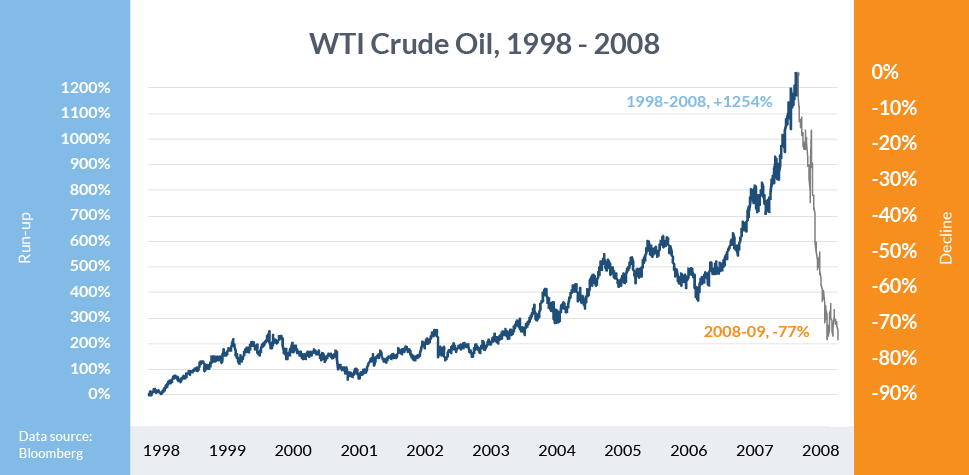
2008: Crude Oil Price Crash
The WTI crude oil bubble began in 1998 at a price of close to $10 per barrel, right around the cost of extracting it from the ground. The rise was persistent through 2007 before prices went vertical until the top in July 2008. The collapse was extremely fierce as the global economy crumbled during the Great Financial Crisis.
From July 2008 to January 2009 oil fell precipitously from $145 to a trough of $35, or 77% in just over six months. This makes the oil price crash one of the most abrupt of all major historical market bubbles.
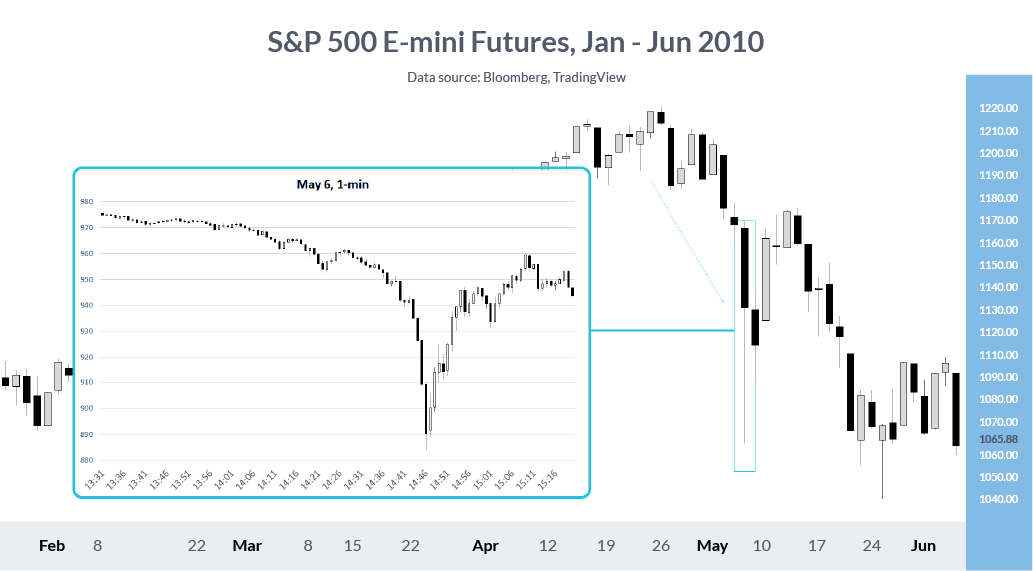
2010: S&P 500 E-mini Futures Flash-Crash
The May 2010 flash-crash imprinted the meaning of flash-crashes deep into the minds of traders, given how large and impactful it was. On May 6th, the stock market was under a bit of stress when suddenly the S&P 500 E-mini futures collapsed by over 6% in about seven minutes before fully erasing those losses in the 10-15 minutes following.
“Navinder Singh Sarao – a trader from Hounslow, London – was accused and found guilty of placing large sell orders which would get cancelled just before they would get filled; a strategy called ‘spoofing’.”
While Navinder Singh Sarao was found guilty of causing the flash-crash (or, as he put it, “just being good at his job”), these events don’t happen out of thin air. They occur when the market is already in a fragile state.
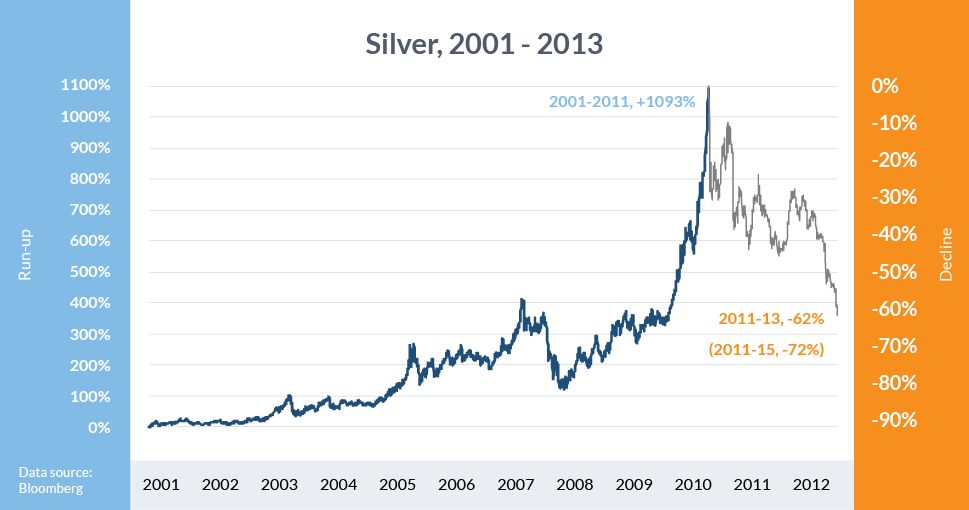
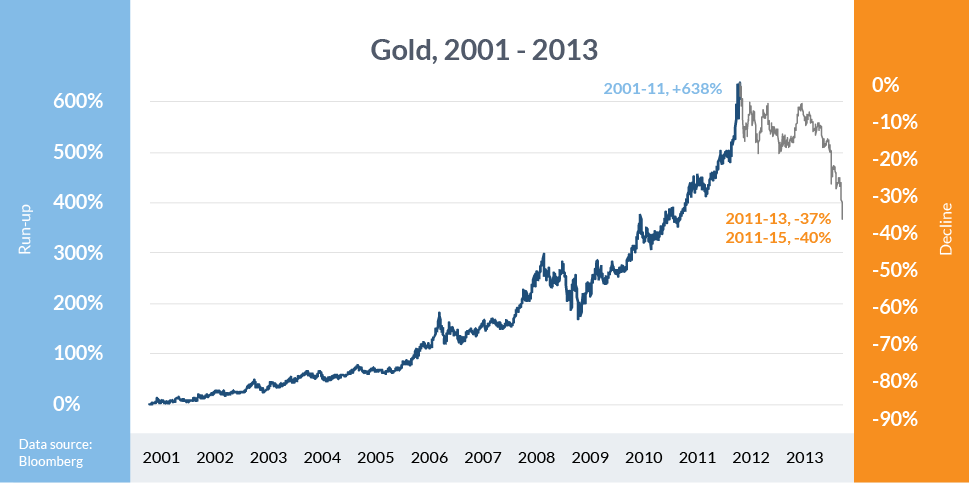
2011: Silver and Gold Price Bubble
This is the second of two major bubbles in the precious metals market, and while not as spectacular as the run-up to the 1980 top, it nevertheless still ranks as one of the bigger bubbles in the history of major markets. The silver bull market began in 1999 and picked up speed during the Great Financial Crisis before the end arrived in April 2011.
Silver
The live silver price can help predict the price movements of a range of financial markets. Monitor it on DailyFX.
Gold peaked at a price of $1896 and silver at $43.25. By June 2013 gold was down by 35% and silver once again outshined the gold bubble on the downside by shedding 56% of its value. Both have traded lower since and at the time of this writing (December 2018) it is still unclear as to whether the bear market cycle is yet over.
Gold
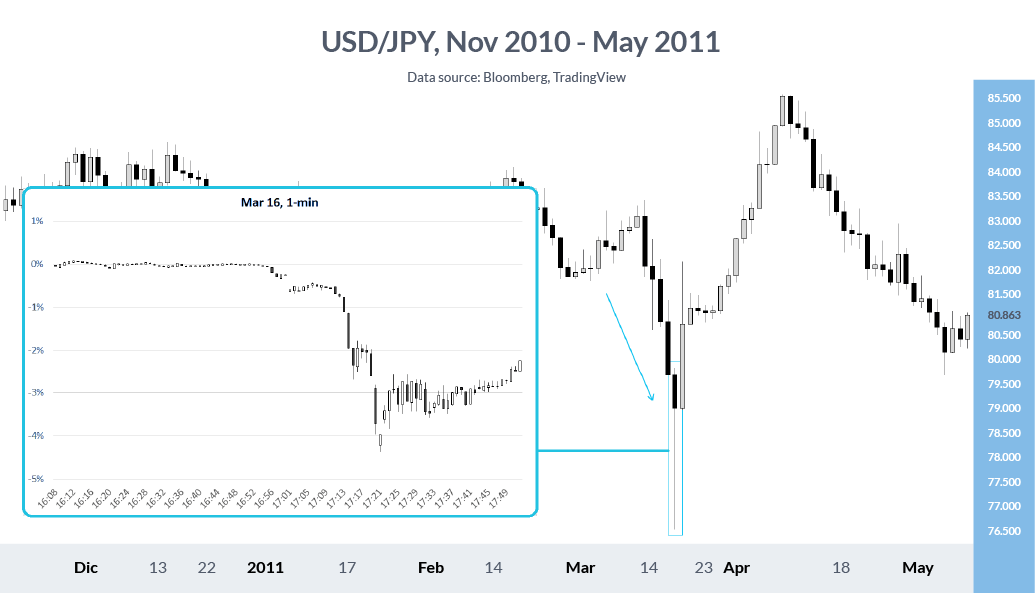
2011: USD/JPY Flash-Crash
As mentioned before, loss of liquidity is a driving force here, particularly with regards to USD/JPY on March 16, 2011. The flash crash of 2011 took place during the least liquid time of the day, just after the U.S. close. Not only was USD/JPY weak on the macro-front, trading at its worst levels on record, but more recently it had come under selling pressure in the wake of a massive earthquake and tsunami in Japan. Market conditions were in a fragile state when this particular liquidity-driven event hit. USD/JPY declined 3% in less than 10 minutes before recovering sharply.
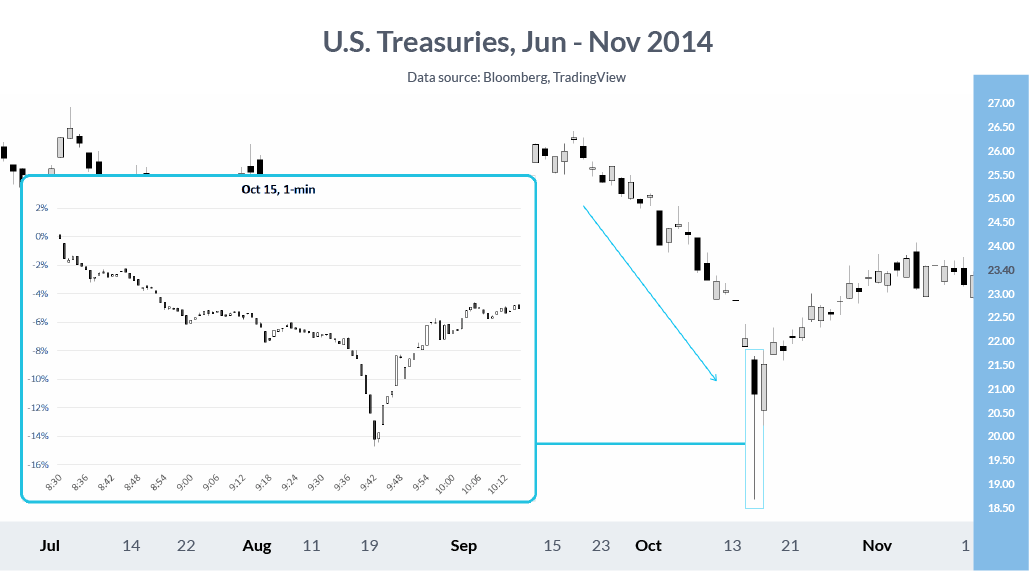
2014: U.S. Treasury Bonds Flash-Crash
The treasury flash-crash on October 15 unfolded after a month-long decline in yields, playing not long after the stock market had opened for the day. The shot lower in yields (higher bond prices) lasted only a few minutes in typical flash-crash style and the price move was immediately wiped away in the minutes to follow. The event became notorious in the treasury bond rates’ history.
2015: EUR/CHF Flash-Crash
Of the examples we’ve looked at, this is the lone flash-crash which was sparked by an abrupt fundamental event. The Swiss National Bank (SNB) announced on January 15th that they were no longer supporting the Swiss Franc vs. the Euro at 1.20, causing the floor many market participants were leaning against to collapse.
The drop was spectacular, as there were trades at some banks going off as low as 0.68. Since there is no official exchange where currencies trade the exact low isn’t known. But looking at the aggregate price move following the news, there was almost an instant decline of over 13%, with few trades executed in this air pocket. The gap took over 3 years to fill.

2016: GBP/USD Flash-Crash
The Great British Pound flash crash came about three months after the Brexit referendum, as the British currency continued to come under strong pressure. Similarly to USD/JPY, this event occurred during an illiquid time of the day, after the U.S. session during early Asian trade.
“The low spike was very extreme, taking no more than a couple of minutes for GBP/USD to decline nearly 5%.”
The recovery in the minutes after wasn’t as sharp as other flash-crash events, but a large portion of losses were recovered in the 20 minutes or so following.

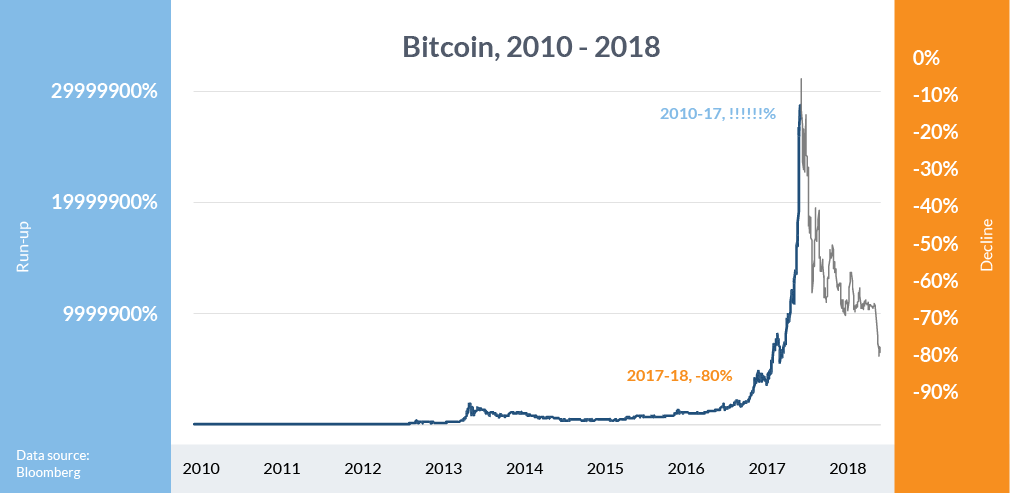
2017: Bitcoin Bubble
The cryptocurrency craze began in 2010 with Bitcoin, and saw a staggering rise from under $1 to nearly $20k by December 2017. However, in mania-like fashion, the majority of those gains came in less than a year, with the price rising from around $700 in January 2017 to Bitcoin’s final peak price of around $19,600 (the exact price depends on the exchange where it was traded).
Without accurate prices from the Tulip days it’s hard to say with pin-point accuracy as to exactly by how much the Bitcoin bubble truly exceeded the Tulip mania, but by achieving literally millions of percent in returns from day one to the end (started at $0.06), does it really matter?
“The Bitcoin fallout at the time of this writing has been around 82% over the course of about a year.”
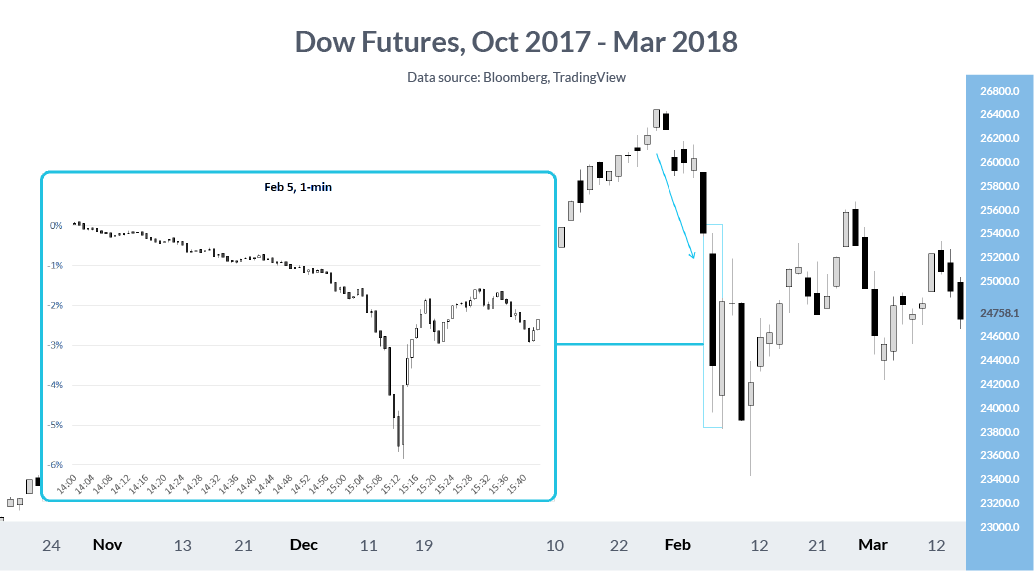
2018: Dow Flash-Crash
Index futures have become increasingly thin over the years, with stock market volumes also declining significantly. This has made index futures extra fragile. This one flew under the radar in some respects, but nevertheless the sudden 4% drop in Dow futures in a 10-minutes window qualifies as a flash-crash. The recovery was equally as fierce.
The other major US indices also underwent similar price swings, but not to the same degree as the Dow. There was no ‘malfunction’ so to speak which caused this, but the market at the time was under short-term stress prior to the event.
Coronavirus Pandemic of 2020
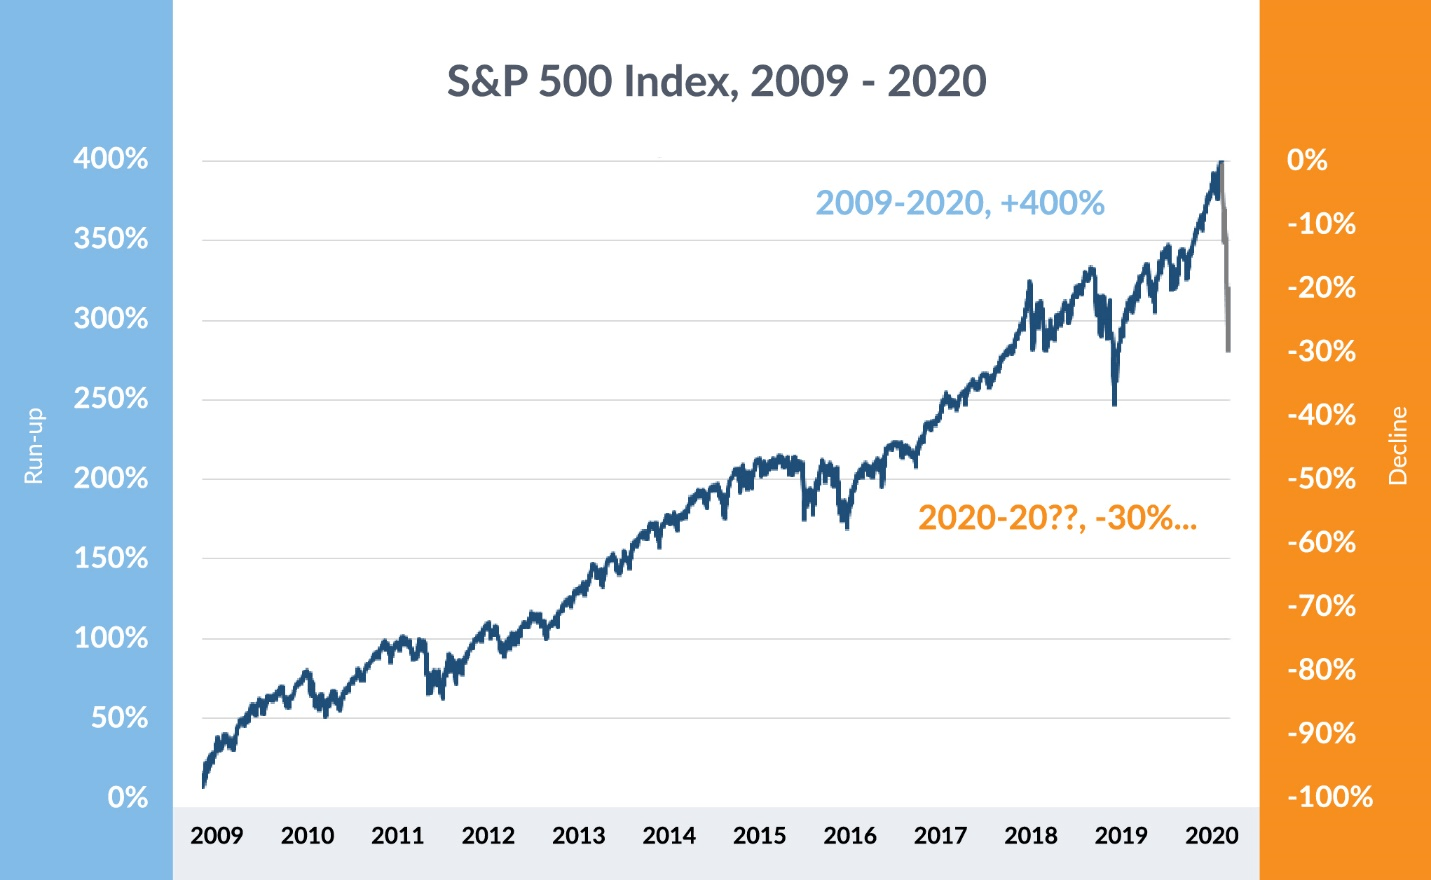
This is one of the most unusual bubbles to pop in history given the catalyst and speed. The story began in January in China, and at first the coronavirus garnered limited attention as it was regarded as merely a regional problem with a limited scope of global impact. But as time wore on into February the situation turned increasingly more dire, with markets abruptly waking up to what turned into a global pandemic and repricing the massive economic risk the virus presents.
What separates this particular cycle from others we’ve looked at is the fact that U.S. stocks were trading at record highs before crashing into bear market territory at a record pace, even faster than the 1929 crash. At the time of this writing, the S&P 500 has lost around 30% of its value in just a month’s time. Typically, crashes come at least a few weeks after the initial top, if not months or longer down the road.
The S&P 500 volatility index behaved just as impressively, with it rocketing to levels only seen during the height of the Great Financial Crisis and the crash of 1987. When looking at the old VIX formula (VXO), it spiked from around 13 to over 100 during the initial crash. An extraordinary move, indeed.
We’ll present more facts and figures later as this historical event continues to unfold. Unfortunately, it’s a story that is far from over.
Looking for forecasts, trade ideas, and educational content? We’ve got you covered on the DailyFX Trading Guides page.
Going Forward…
Financial bubbles, crises, and flash-crashes aren’t an everyday occurrence, but have been happening at a frequent enough rate in recent years that market participants should have familiarity with them.
Whether you’re trading in major commodities such as oil, gold and silver or in major stock indices such as the Dow Jones, the S&P 500 or the Nikkei, knowing the history of your trading market is the key to success in the future.


