


Talking Points:
- The tumble in risk assets led by the S&P 500 and US indices steadied this past session despite the thrum of trade wars
- Reports of agreement between the UK government and EU on a border deal set off a Sterling rally and series of rumors and headlines
- US crude oil dropped an unprecented 12th straight trading session with an extraordinary 6 percent plunge drawing traders' focus
What makes for a 'great' trader? Strategy is important but there are many ways we can analyze to good trades. The most important limitations and advances are found in our own psychology. Download the DailyFX Building Confidence in Trading and Traits of Successful Traders guides to learn how to set your course from the beginning.
Risk Aversion Regains Traction During US Trade
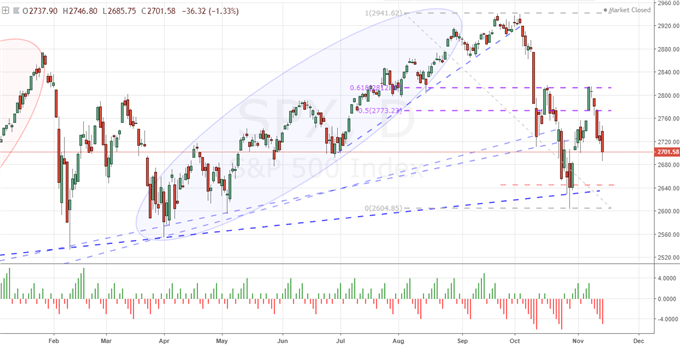
Global risk assets were a mixed bag for much of Wednesday's trading session, further cooling the fear that had developed in the three-day spill over Thursday, Friday and Monday. Yet, a lack of conviction should not be interpreted as a positive sign - which has been so often the case over these years of buoyancy borne of complacency. After a restricted day for Asian and European shares, the bears started to rouse once again during the New York trading session. The S&P 500 and Dow extended consecutive declines (a 5 and 4-day stretch respectively) which maintains a healthy appreciation of the general state of market activity throughout 2018. These benchmark indices are still a fair distance from their respective critical support levels. Therefore, it is less likely that we 'suddenly' find ourselves at the transition to a technically-defined systemic risk aversion. Of course, motivation does not necessarily depend on chart milestones. There are critical themes that continue to lurk around the fragile stability that has beat back the self-sustaining deleveraging wave that could develop should investors seize on one of the more systemic risks. Trade wars remains one of those overarching themes with the US trade team reportedly lacking a cohesive strategy in their dealings with China. Keep an eye on that 7.0000 benchmark for USDCNH. There were reports the US trade group's revived discussion into EU auto tariffs had been shelved, but EU trade commissioner Malmstrom said that she was given no assurances. A more 'rudimentary' theme to keep tabs on is basic growth. The IMF's warning of weaker economic growth moving forward was revived this week and global sovereign debt yields may reflect that risk along with its subsequent ramifications - like a curb on efforts to normalize monetary policy.
Chart of S&P 500 and Consecutive Candle Count (Daily)
Brexit Headline Whiplash Leads to Multiple Intraday Pound Reversals
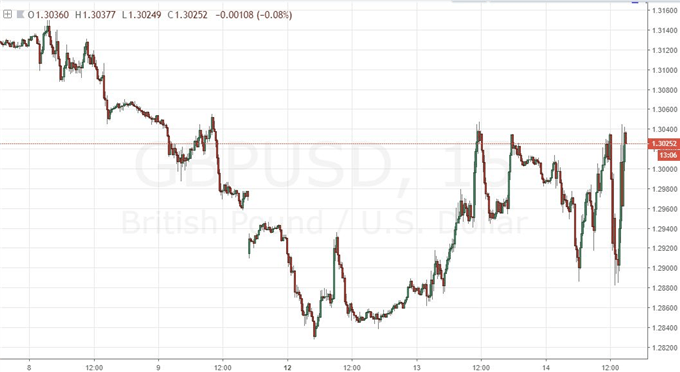
If there were a top headline among the global markets this past session, it would certainly have been Brexit. The UK's divorce from the European Union has been a saga of false hopes born of politicians' optimism repeated dashed by reality of their inability to make critical headway in the deal. Recently, the swing from enthusiasm to outright fear in the next steps in this separation has sped up to happen within the span of less than a week. That is probably owing to the quickly dwindling clock to the inevitable Brexit date scheduled for March 29. As rapid as the switchbacks have been for this important theme, they were at least spaced with enough time to allow for reasonable preparation by traders. That buffer was removed this past session however, when the optimistic to pessimistic and back again swings sentiment around the event happened in the span of a few hours. The day started off with the carry over of Tuesday evening reports that Prime Minister May and her close advisors had agreed with the EU to a draft bill on necessary criteria to break the impasse. After a series of one-on-one meetings with her cabinet meetings, reports that May's own government was prepared to block her evolved into headlines suggesting a 'no confidence' vote was coming. That would not only stymie progress on Brexit buy further gridlock the UK government's ability to move forward. With a press conference reportedly pushed off and visits to the EU canceled, the market's start to look ahead ot Thursday for a vote that would send the UK into political upheaval again. And yet, before the day was done, reports broke that May's cabinet had voted to support the draft deal that was had the EU's support. The last move of the active session was another sharp rally, but we have yet to see GBPUSD overtake 1.3200 much less 1.3500. There are still hurdles to overtake and the markets have grown even more dubious of progress. Nevertheless, keep a close eye on the Pound as the light at the end of the tunnel grows brighter.
Chart of GBPUSD (15 Minute)
EURUSD Trading Means De-Emphasizing Traditional Data for Key Themes
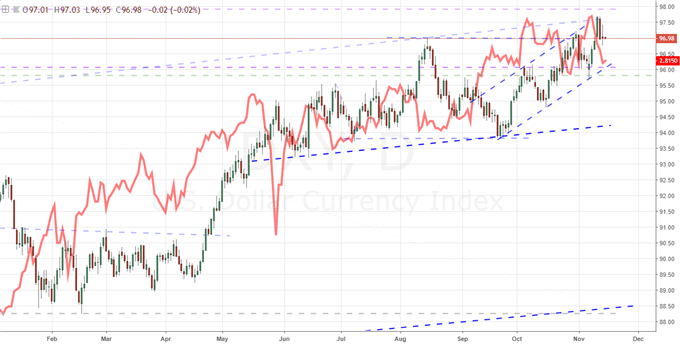
When it comes to a theme like Brexit, it is possible to command total control over the market's speculative bearings with the proper exertion of pressure. However, as much influence as these themes may carry, they aren't always under power and promoting a bullish or bearish trend. Point-in-case, we have the EURUSD. The benchmark pair is at the center of a number of overlapping fundamental themes, yet there remains a distinct lack of total control by these critical weather fronts. On the Euro side, the currency actually managed an advance this past session despite the budget standoff between Italy and the European Union hitting a proverbial wall this week. Italy's government rejected the EU's calls for a more austere spending program and tempered forecast for GDP and the comparisons to Greece 8 years ago move one step forward. Why is the Euro not tipping into an unchecked tumble? We have been exactly here before with an existential threat hanging over the Euro's head, yet complacency managed to flourish as the absolute crisis was always pushed back. On the other side of the FX market's benchmark pair, the Dollar has plenty to process from headlines suggesting the Senate majority leader is standing in the way of the infrastructure program, growth forecasts have slowed and interest rate forecasts were coming under pressure. Instead of these overbearing threats to the Greenback's supremacy, the currency seems to be drawing on its counterpart status to its most liquid - and active - peers.
Chart of DXY Dollar Index and Implied Fed Funds Rate for December 2019 (Daily)
Crude Oil Finally Bounces but Natural Gas Steals the Energy Market's Bullish Title
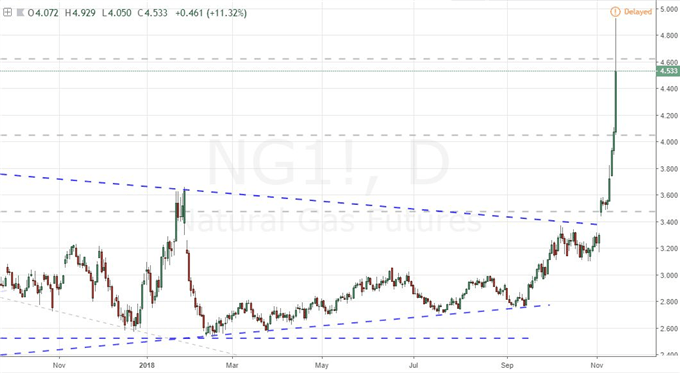
One of the most incredible trends that we have seen across the financial markets in some years has finally come to a close - though that does not mean that a course reversal is ensured. US crude oil finally put in for a bullish daily close Wednesday for the first time in 13 trading days. That brought to a close the longest run of consecutive daily losses in the commodity's lengthy historical record and it will likely be a long time before we see it matched, much less overtaken. Often, we traders happen on such a remarkable move - either for intensity or consistency, this happened to be both - there is an immediate appetite to trade a reversal. It may be true that the persistence of consecutive losses was statistically improbable to continue, but all we need to end that run would be a bullish close. That advance can be marginal with no intent to give rise to a lasting bull trend. Oil has dropped nearly 30 percent in the span of a month and it is certainly stretched. Yet, if the disconnect from traditional supply-demand fundamentals and disregard for technicals continues, speculative deleveraging can absolutely carry it further before this bearish leg ultimately concludes. Meanwhile, oil isn't the only natural resource in motion. Natural gas stole the show Wednesday with a surge of 15 percent Wednesday that was as much as 20 percent through the session high and a mere four days covering nearly 39 percent. Volatility is growing more common. Trade cautiously. We discuss all of this and more in today's Trading Video.
Chart of Natural Gas Active Futures Contract (Daily)
If you want to download my Manic-Crisis calendar, you can find the updated file here.


