


TRADE SETUPS FOR NEXT WEEK USING BOLLINGER BANDS: GOLD, GBP/USD, USD/CAD, DOW
- Gold, GBP/USD, USD/CAD and the Dow Jones have interesting technical setups when analyzing market price action with Bollinger Bands
- Find out How to Use Bollinger Bands and incorporate them into your trading strategy
- Join DailyFX and IG for An Evening with John Bollinger, founder of the Bollinger Band technical indicator
Dynamic markets in light of ongoing trade war uncertainty and lingering Brexit risk can make it difficult to analyze price trends. The ebb and flow of price action is often lost on traders trying to chase markets who tend to get burned. That is why traders frequently use Bollinger Bands when performing technical analysis seeing that they can be applied across all financial markets, used over most timeframes, and are particularly useful in forex trading.
TRADING WITH BOLLINGER BANDS
Volatility, which reflects variance in prices over a given timeframe, can be measured several ways. One popular technical indicator used to gauge price volatility of an asset is the Bollinger Band. Bollinger bands are typically setup with a 2-standard deviation channel around an underlying’s 20-day simple moving average, which, statistically speaking, encompasses price action roughly 95% of the time. As such, Bollinger Bands can illustrate both volatility and whether an asset is oversold or overbought in one simple to read technical indicator. With that in mind, Bollinger Bands can be incorporated into various trading strategies and help traders identify new opportunities.
For more information on Bollinger Bands, join the founder of the technical indictor himself, John Bollinger, for a meet and greet hosted by DailyFX and IG. Register for An Evening with John Bollinger Here.
GBP/USD PRICE CHART: DAILY TIME FRAME (JUNE 11, 2019 TO OCTOBER 25, 2019)
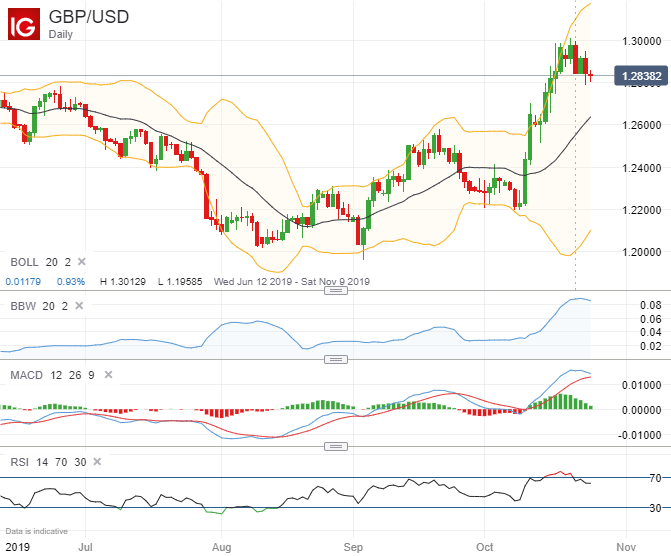
GBP/USD has been driven overwhelmingly by the latest Brexit developments for quite some time and over the last few days in particular. When approaching the cable with a technical perspective, however, spot GBP/USD price action reveals an interesting backdrop judging by the recent Bollinger Band expansion and apparent start of compression.
GBP/USD exploded higher earlier this month owing to an influx of Brexit deal hopes which pushed spot prices above its expanding 2-standard deviation Bollinger Band. Now, forex traders could be on the cusp of witnessing a major Bollinger Band squeeze as the width of the Bollinger Band contracts. Meanwhile, it seemingly increasingly likely that the UK will delay Brexit once more, which could cause spot GBP/USD prices to revert back toward its 20-day simple moving average.
USD/CAD PRICE CHART: DAILY TIME FRAME (MAY 24, 2019 TO OCTOBER 24, 2019)
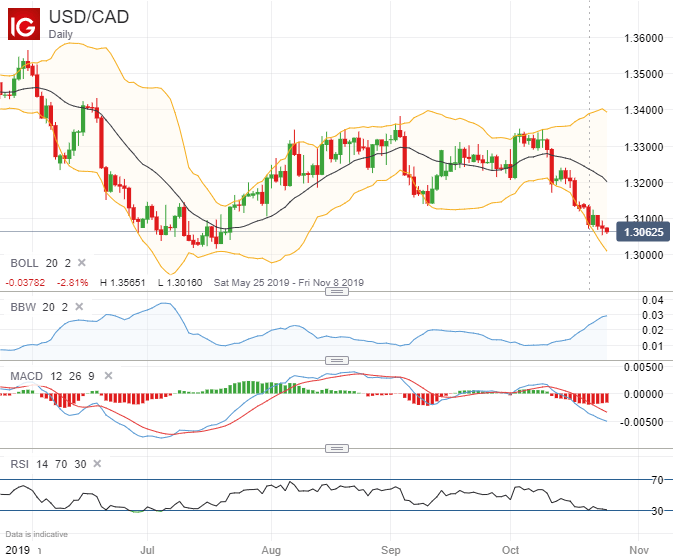
USD/CAD has moved sharply lower over the last several days with selling pressure accelerating after spot prices sank below the 1.3200 level. The aggressive drop in USD/CAD recently has further propelled the currency pair’s recent Bollinger Band expansion, though spot prices are approaching a major level of confluent support near the 1.3000 handle.
Though there may be room for the recent downtrend to continue – particularly in light of the October Fed meeting and expected FOMC interest rate cut next week – spot prices have potential to rebound if volatility soon recedes. Evidence of a Bollinger Band squeeze might indicate that a bullish reversal in USD/CAD could be in the cards. Meanwhile, the RSI is currently teetering on the brink of “oversold territory” which may be supportive of mean-reversion higher.
GOLD PRICE CHART: DAILY TIME FRAME (MAY 02, 2019 TO OCTOBER 25, 2019)
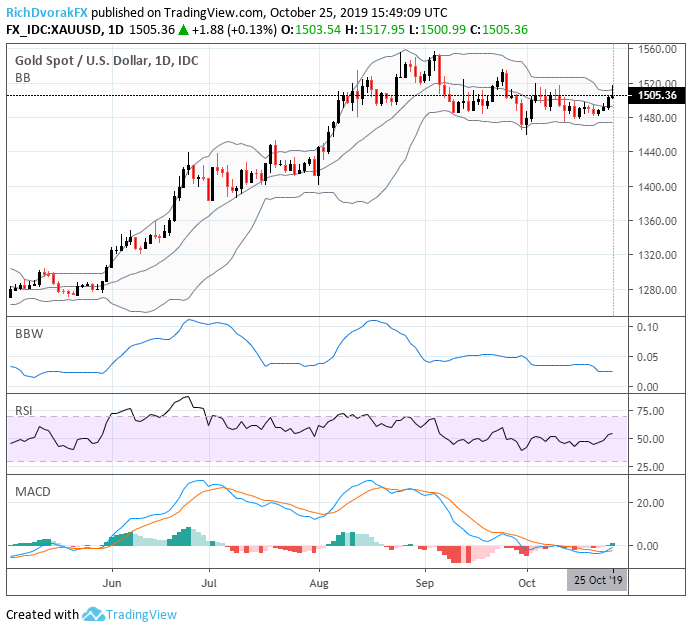
Chart created by @RichDvorakFX with TradingView
The price of gold has churned steadily lower since printing its year-to-date high around the $1,555 price level early last month. The drift to the downside in spot gold recently has caused a major Bollinger Band compression, yet recent price action could suggest the commodity’s consolidation since September is nearing its end with XAU/USD on the verge of a major breakout. Also, with bullish divergence indicated by the MACD coupled with the recent Bollinger Band compression, a pickup in gold price volatility could be forthcoming.
This could result in a Bollinger Band expansion and foster further upside in spot gold as the commodity rides its upper Bollinger Band higher. That said, the commodity could pivot back toward support provided by its 20-SMA considering a 2-standard deviation Bollinger Bands statistically encompasses price action 95% of the time and seeing that gold faces a daunting resistance level near $1,520.
DOW JONES INDEX PRICE CHART: DAILY TIME FRAME (MAY 02, 2019 TO OCTOBER 25, 2019)
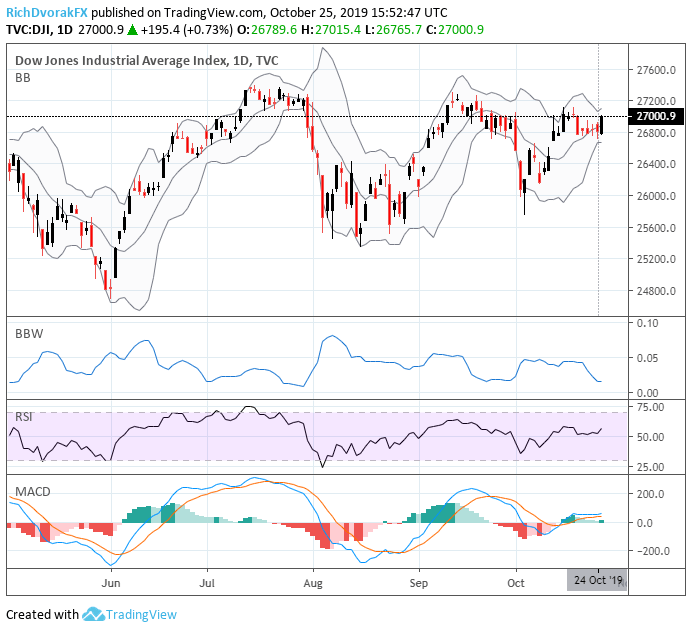
Chart created by @RichDvorakFX with TradingView
Another positive trait of Bollinger Bands is their versatility. While the standard Bollinger Band is typically set to 2-standard deviations away from its 20-period simple moving average, both components of the technical indicator can be changed to encompass different time frames and measure volatility differently. That said, looking at a daily Dow Jones price chart but changing the period on the Bollinger Band to a shorter 10-day lookback better illustrates the recent compression of price action.
Yet the sizable jump the Dow Jones is on pace to record today leaves the equity index on the precipice of a Bollinger Band expansion. This could reflect that the Dow Jones is gearing up for a major breakout over the coming days and high-impact event risk scheduled for next week and detailed on the DailyFX Economic Calendar could provide a fundamental catalyst sparking the move.
--- Written by Rich Dvorak, Junior Analyst for DailyFX.com
Connect with @RichDvorakFX on Twitter for real-time market insight


