


Gold Price Outlook:
- Despite a sharp decline in recent days, a weaker US Dollar hasn’t translated into gains for gold prices.
- Gold prices remain on track to fall below 1700 over the coming weeks.
- According to the IG Client Sentiment Index, gold prices have a bearish bias in the near-term.

Humdrum Rebound
Gold prices have proved lackluster in recent days, which is actually a fairly concerning development. Through today, the US Dollar (via the DXY Index) was down as much as -2.64% from its yearly high set last Thursday, while gold prices have only managed a +0.5% gain from last week’s low. Gold’s tepid, humdrum rebound bodes poorly, and underscores the difficult fundamental environment (rising US real yields) it continues to face now more than halfway through July.
Gold Volatility Continues to Erode
Historically, gold prices have a relationship with volatility unlike other asset classes. While other asset classes like bonds and stocks don’t like increased volatility – signaling greater uncertainty around cash flows, dividends, coupon payments, etc. – gold tends to benefit during periods of higher volatility. Further erosion in gold volatility suggests that more weakness is possible for gold prices.
GVZ (Gold Volatility) Technical Analysis: Daily Price Chart (July 2021 to July 2022) (Chart 1)
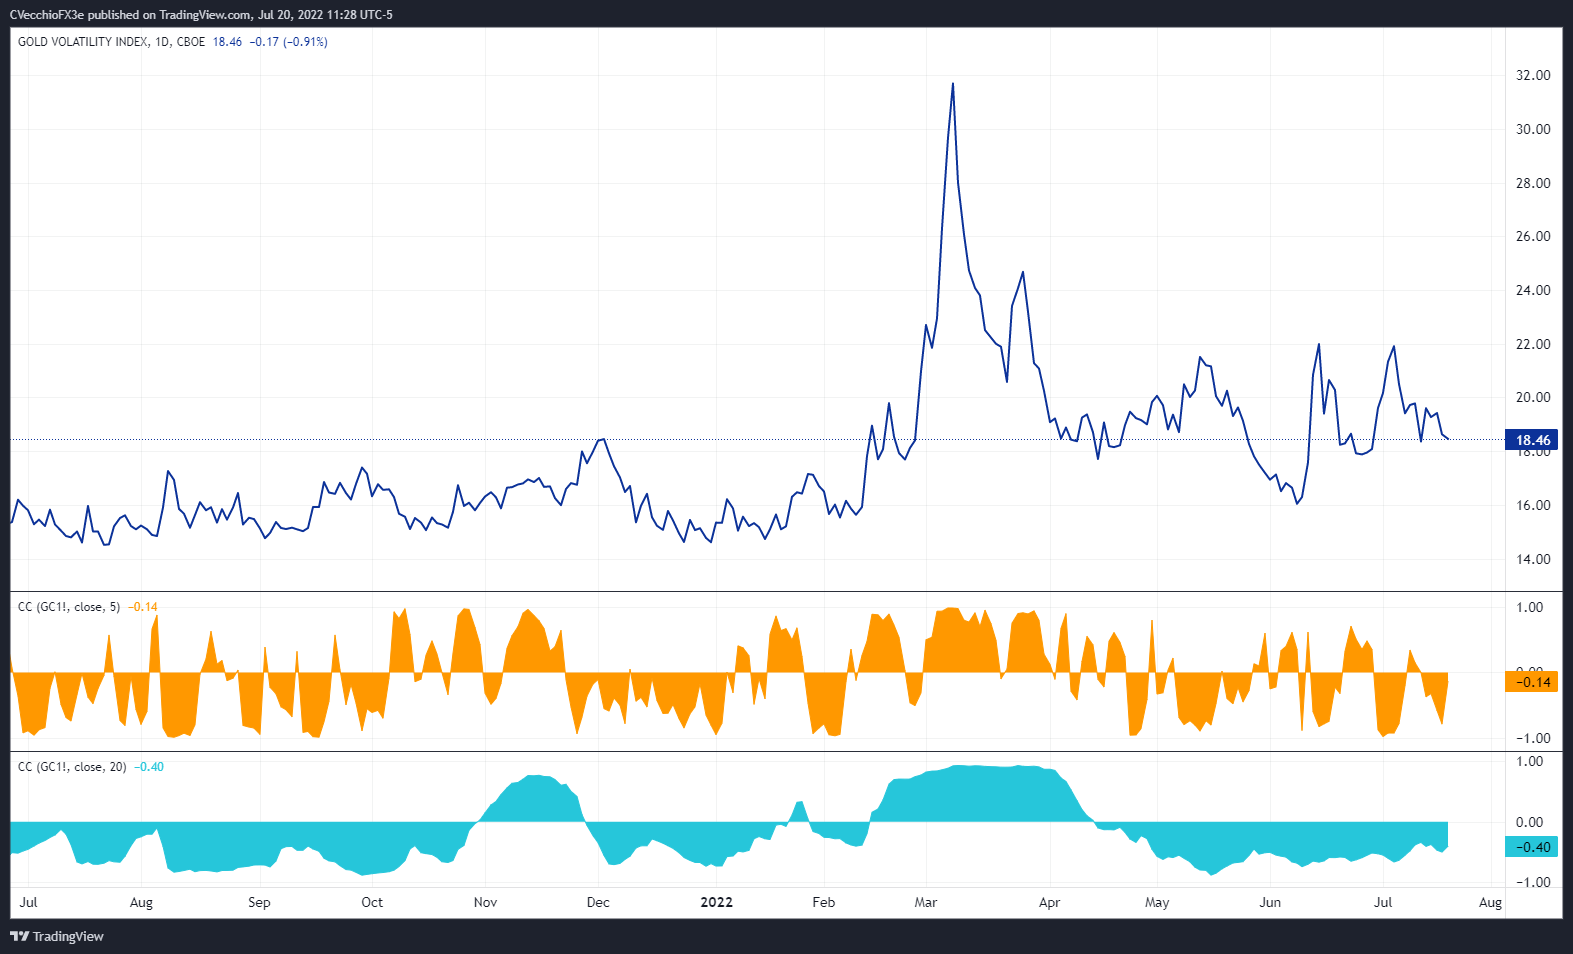
Gold volatility (as measured by the Cboe’s gold volatility ETF, GVZ, which tracks the 1-month implied volatility of gold as derived from the GLD option chain) was trading at 18.46 at the time this report was written. The 5-day correlation between GVZ and gold prices is -0.14 while the 20-day correlation is -0.40. One week ago, on July 13, the 5-day correlation was 0.00 and the 20-day correlation was -0.34.
Gold Price Rate Technical Analysis: Daily Chart (July 2021 to July 2022) (Chart 2)
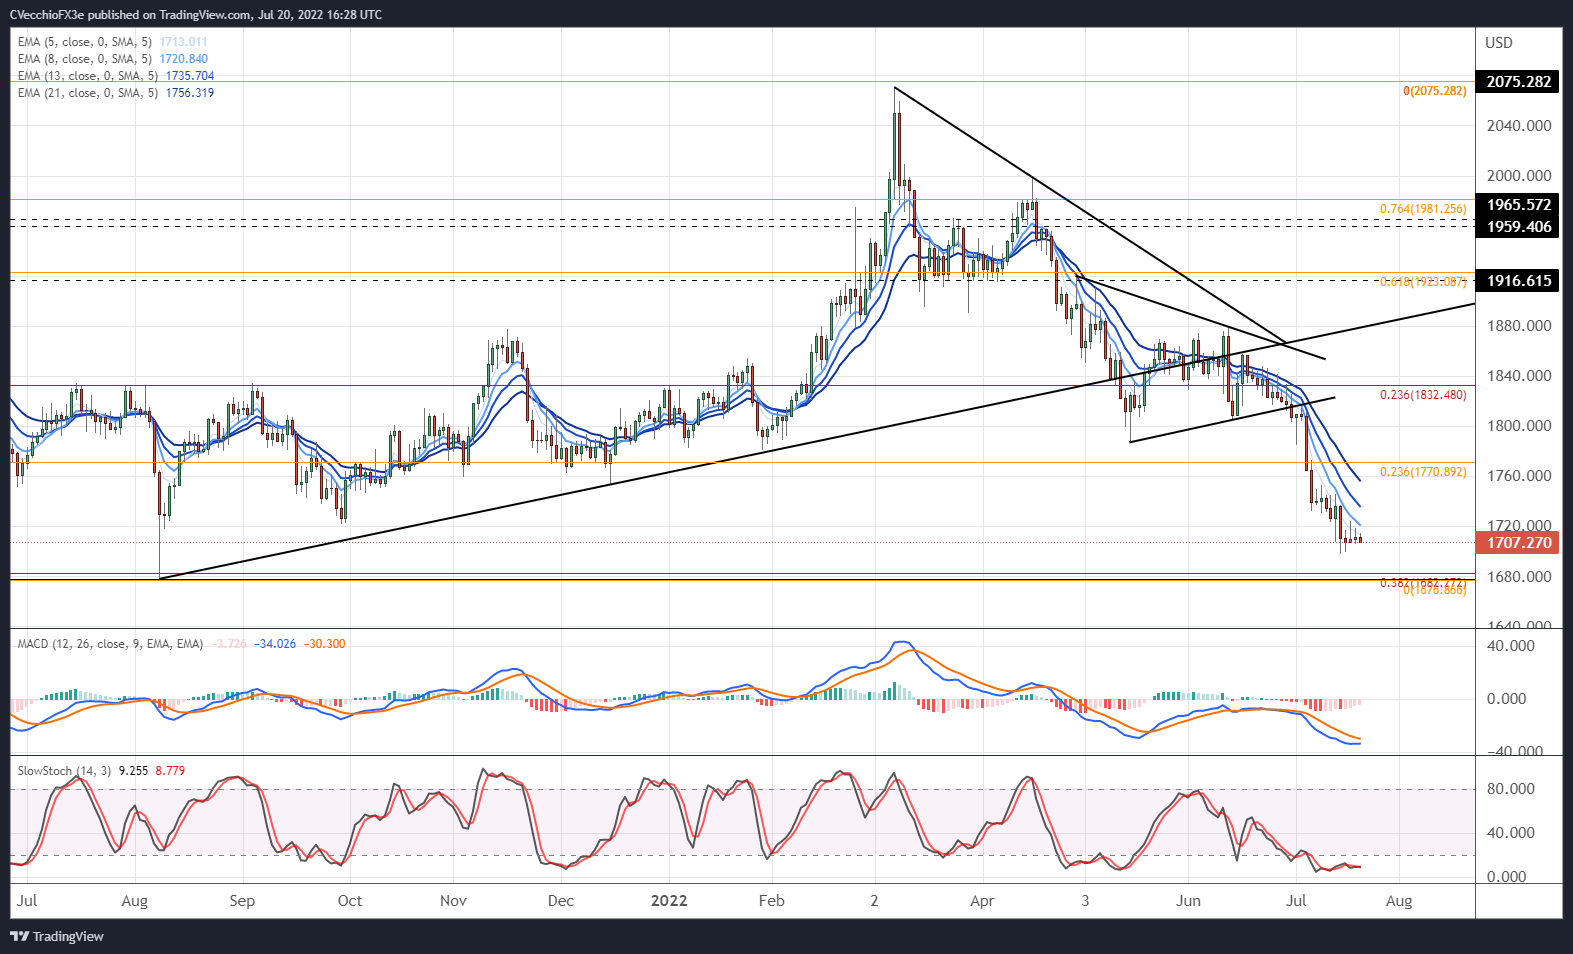
The technical structure for gold prices remains outright bearish in the near-term. Momentum retains an overt negative tone. Gold prices are still below their daily 5-, 8-, 13-, and 21-EMA envelope, which is aligned in bearish sequential order. Daily MACD’s descent below its signal line continues, while daily Slow Stochastics are nestled in oversold territory. It remains the case that “the measured move out of the triangle calls for a drop towards 1680 over the coming weeks – right to where the 2021 lows were found.”
Gold Price Technical Analysis: Weekly Chart (October 2015 to July 2022) (Chart 3)
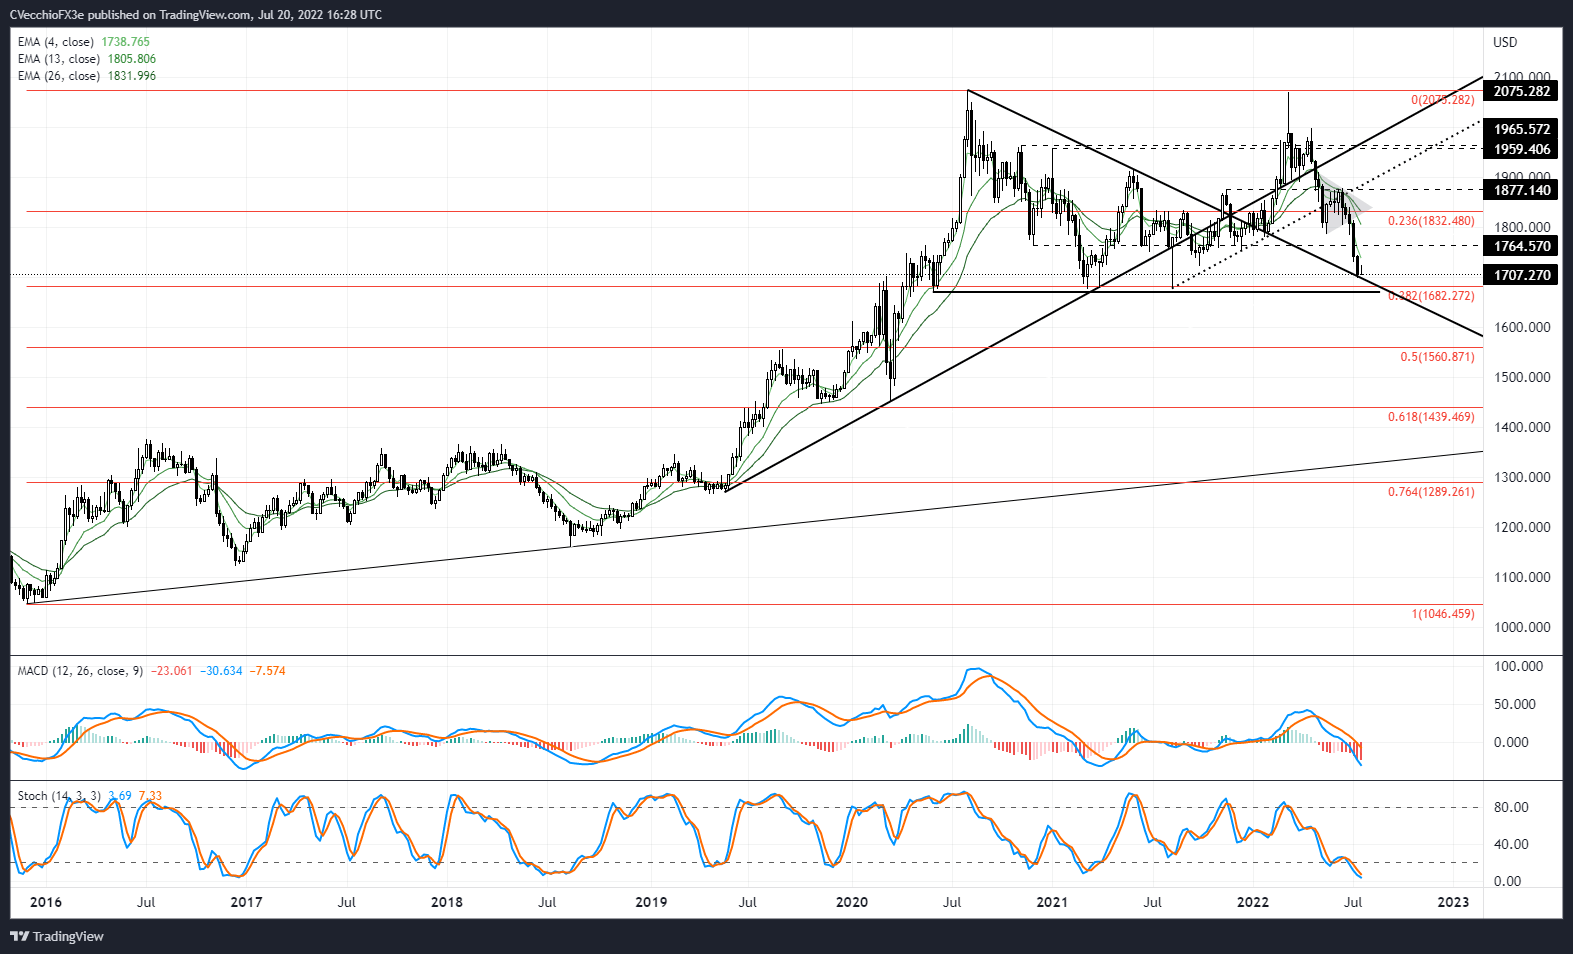
A lack of significant improvement in price action leaves the longer-term outlook unchanged for gold prices. The view remains that “the weekly timeframe continues to suggest that a double top is forming for gold prices, with the two peaks carved out by the August 2020 and March 2022 highs. A return to the area around the 2021 low, near the 38.2% Fibonacci retracement of the 2015 low/2020 high range at 1682.72, seems likely soon.”

IG CLIENT SENTIMENT INDEX: GOLD PRICE FORECAST (July 20, 2022) (Chart 4)
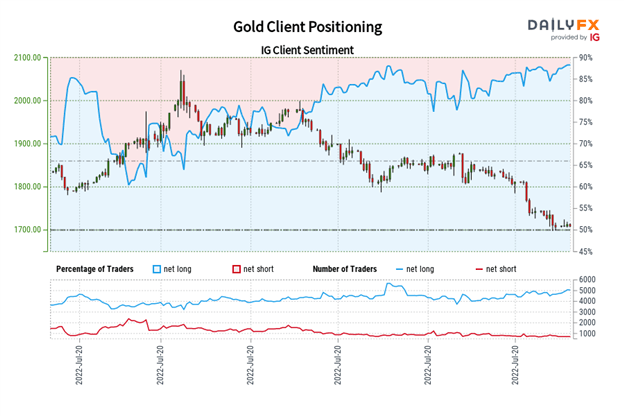
Gold: Retail trader data shows 88.48% of traders are net-long with the ratio of traders long to short at 7.68 to 1. The number of traders net-long is 1.84% higher than yesterday and 12.40% higher from last week, while the number of traders net-short is 4.32% lower than yesterday and 21.05% lower from last week.
We typically take a contrarian view to crowd sentiment, and the fact traders are net-long suggests Gold prices may continue to fall.
Traders are further net-long than yesterday and last week, and the combination of current sentiment and recent changes gives us a stronger Gold-bearish contrarian trading bias.
Trade Smarter - Sign up for the DailyFX Newsletter
Receive timely and compelling market commentary from the DailyFX team
--- Written by Christopher Vecchio, CFA, Senior Strategist


