


Gold Price Outlook:
- Gold prices continue to edge lower, thanks in part to a dispiriting fundamental and technical backdrop.
- The measured move from the symmetrical triangle breakout calls for gold prices to fall below 1700 over the coming weeks.
- According to the IG Client Sentiment Index, gold prices hold a mixed bias in the near-term.

Nothing to Like
Gold prices continue to trade lower after breaking out of their multi-month symmetrical triangle to the downside. The technical outlook remains weak, with price action suggesting that a move below 1700 is possible in the coming weeks. The fundamental story remains bearish as well, as rising US real yields – nominal Treasury yields less inflation expectations – remain higher. The “sell the rally” perspective remains valid for the foreseeable future, plain and simple.
Gold Volatility Continues Decline
Historically, gold prices have a relationship with volatility unlike other asset classes. While other asset classes like bonds and stocks don’t like increased volatility – signaling greater uncertainty around cash flows, dividends, coupon payments, etc. – gold tends to benefit during periods of higher volatility. A double top in gold volatility offers a foreboding signal for what’s next for gold prices.
GVZ (Gold Volatility) Technical Analysis: Daily Price Chart (July 2021 to July 2022) (Chart 1)
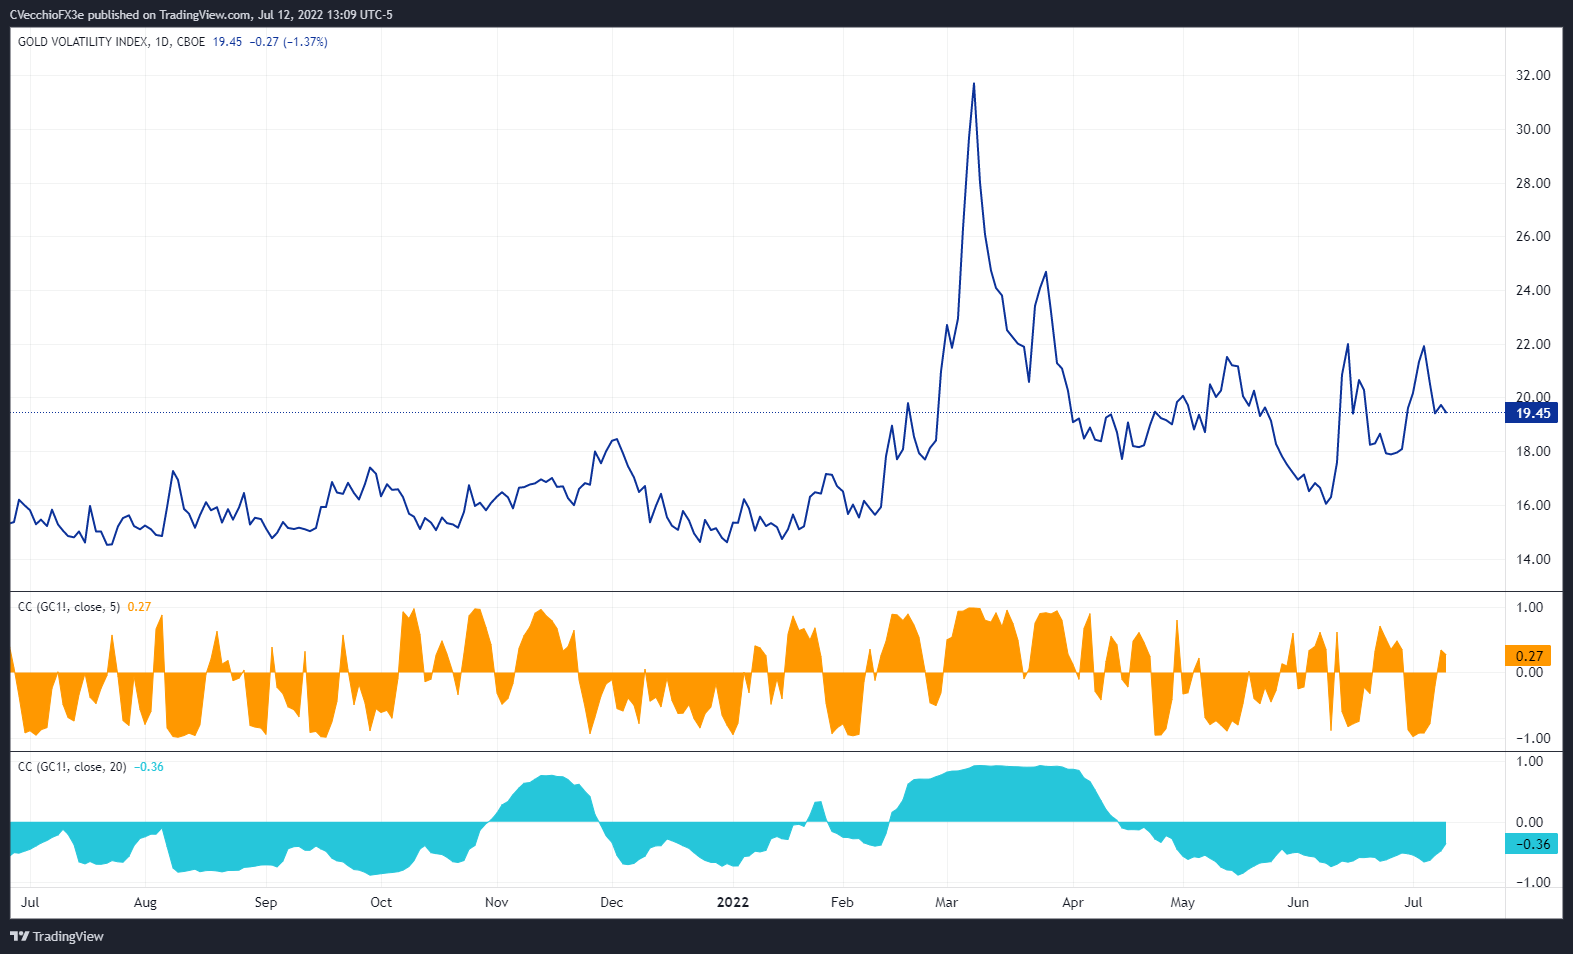
Gold volatility (as measured by the Cboe’s gold volatility ETF, GVZ, which tracks the 1-month implied volatility of gold as derived from the GLD option chain) was trading at 19.45 at the time this report was written. The 5-day correlation between GVZ and gold prices is +0.27 while the 20-day correlation is -0.36. One week ago, on July 5, the 5-day correlation was -0.93 and the 20-day correlation was -0.60.
Gold Price Rate Technical Analysis: Daily Chart (July 2021 to July 2022) (Chart 2)
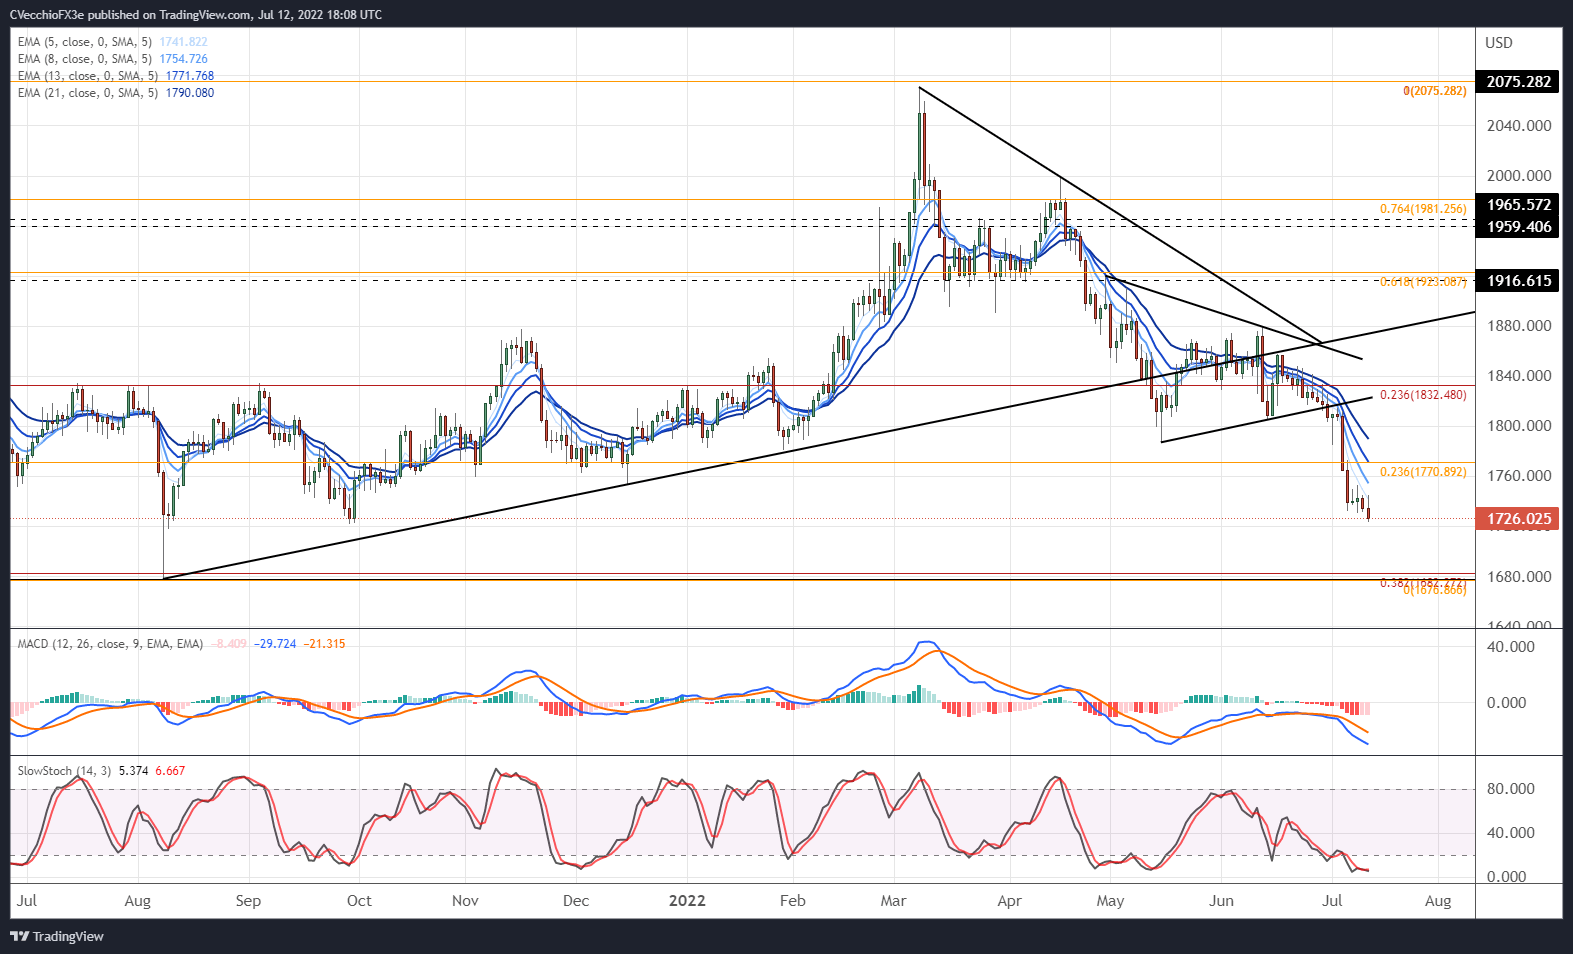
Gold prices have meaningfully dropped below the 23.6% Fibonacci retracement of the 2020 high/2021 low range at 1770.89 following their anticipated symmetrical triangle breakout. The technical structure is increasingly bearish, with momentum taking a sharp negative tone. Gold prices remain below their daily 5-, 8-, 13-, and 21-EMA envelope, which is aligned in bearish sequential order. Daily MACD’s descent below its signal line is deepening, while daily Slow Stochastics are buried oversold territory. The measured move out of the triangle calls for a drop towards 1680 over the coming weeks – right to where the 2021 lows were found.
Gold Price Technical Analysis: Weekly Chart (October 2015 to July 2022) (Chart 3)
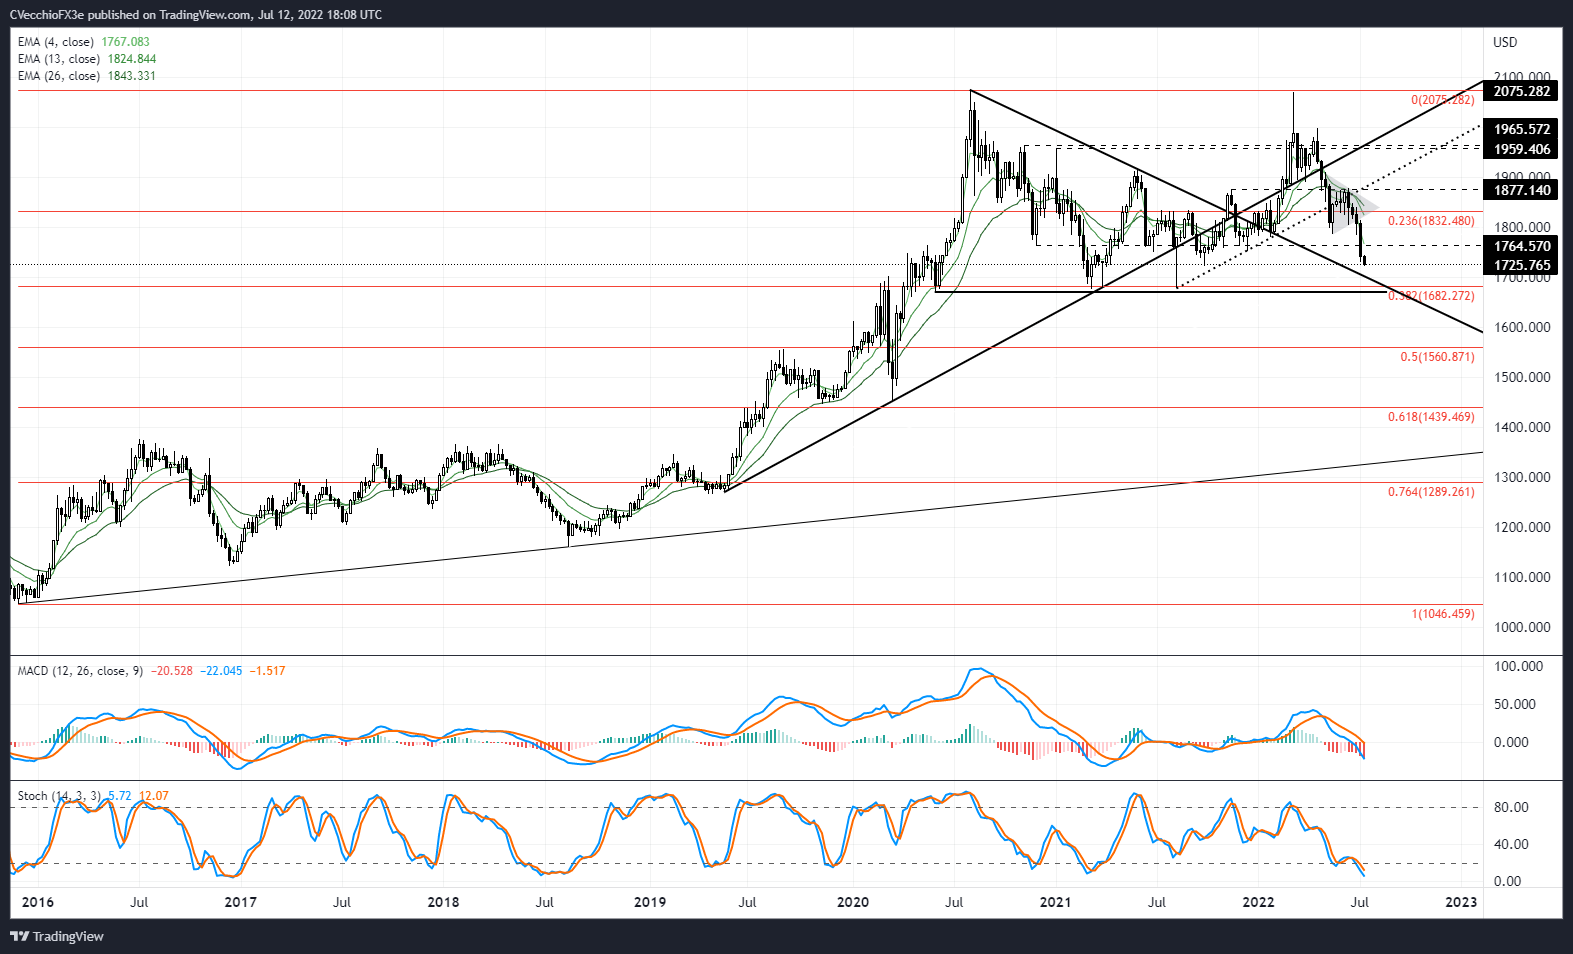
As noted many times previously, “a drop below the June low of 1805.21 would increase the likelihood of a sustained move beneath 1800 over the next few months.” This is indeed playing out, consistent with the aforementioned view that “the weekly timeframe continues to suggest that a double top is forming for gold prices, with the two peaks carved out by the August 2020 and March 2022 highs.” A return to the area around the 2021 low, near the 38.2% Fibonacci retracement of the 2015 low/2020 high range at 1682.72, seems likely soon.

IG CLIENT SENTIMENT INDEX: GOLD PRICE FORECAST (July 12, 2022) (Chart 4)
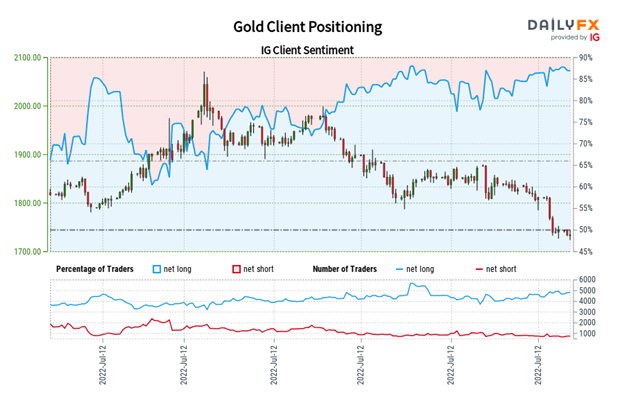
Gold: Retail trader data shows 84.40% of traders are net-long with the ratio of traders long to short at 5.41 to 1. The number of traders net-long is 2.10% lower than yesterday and 1.80% higher from last week, while the number of traders net-short is 11.27% higher than yesterday and 1.76% higher from last week.
We typically take a contrarian view to crowd sentiment, and the fact traders are net-long suggests Gold prices may continue to fall.
Positioning is less net-long than yesterday but more net-long from last week. The combination of current sentiment and recent changes gives us a further mixed Gold trading bias.
Trade Smarter - Sign up for the DailyFX Newsletter
Receive timely and compelling market commentary from the DailyFX team
--- Written by Christopher Vecchio, CFA, Senior Strategist


