


Gold Price Outlook:
- Gold prices continue to trade within a multi-week symmetrical triangle dating back to April.
- Fundamental headwinds remain – rising US real yields – and are unlikely to abate any time soon.
- According to the IG Client Sentiment Index, gold prices hold a mixed bias in the near-term.

More Sideways Trading
Gold prices have made little progress in recent days, sustaining elevation after establishing their monthly lows last week around 1805. Truth be told, gold prices haven’t made much progress for the better part of the past month, continuing to range within the symmetrical triangle carved out since the end of April.
The prospect for a significant move higher by gold prices remains limited at best. US real yields – nominal Treasury yields less inflation expectations – continue to press higher, a formidable headwind. It thus remains the case that “any short-term rallies by gold prices retain a ‘sell the rally’ mindset, particularly as gold prices don’t have a bullish seasonality tendency in June.”
Gold Volatility Continues Decline
Historically, gold prices have a relationship with volatility unlike other asset classes. While other asset classes like bonds and stocks don’t like increased volatility – signaling greater uncertainty around cash flows, dividends, coupon payments, etc. – gold tends to benefit during periods of higher volatility. Gold volatility’s continued drop over the past week bodes poorly for gold price’s immediate prospects.
GVZ (Gold Volatility) Technical Analysis: Daily Price Chart (June 2021 to June 2022) (Chart 1)
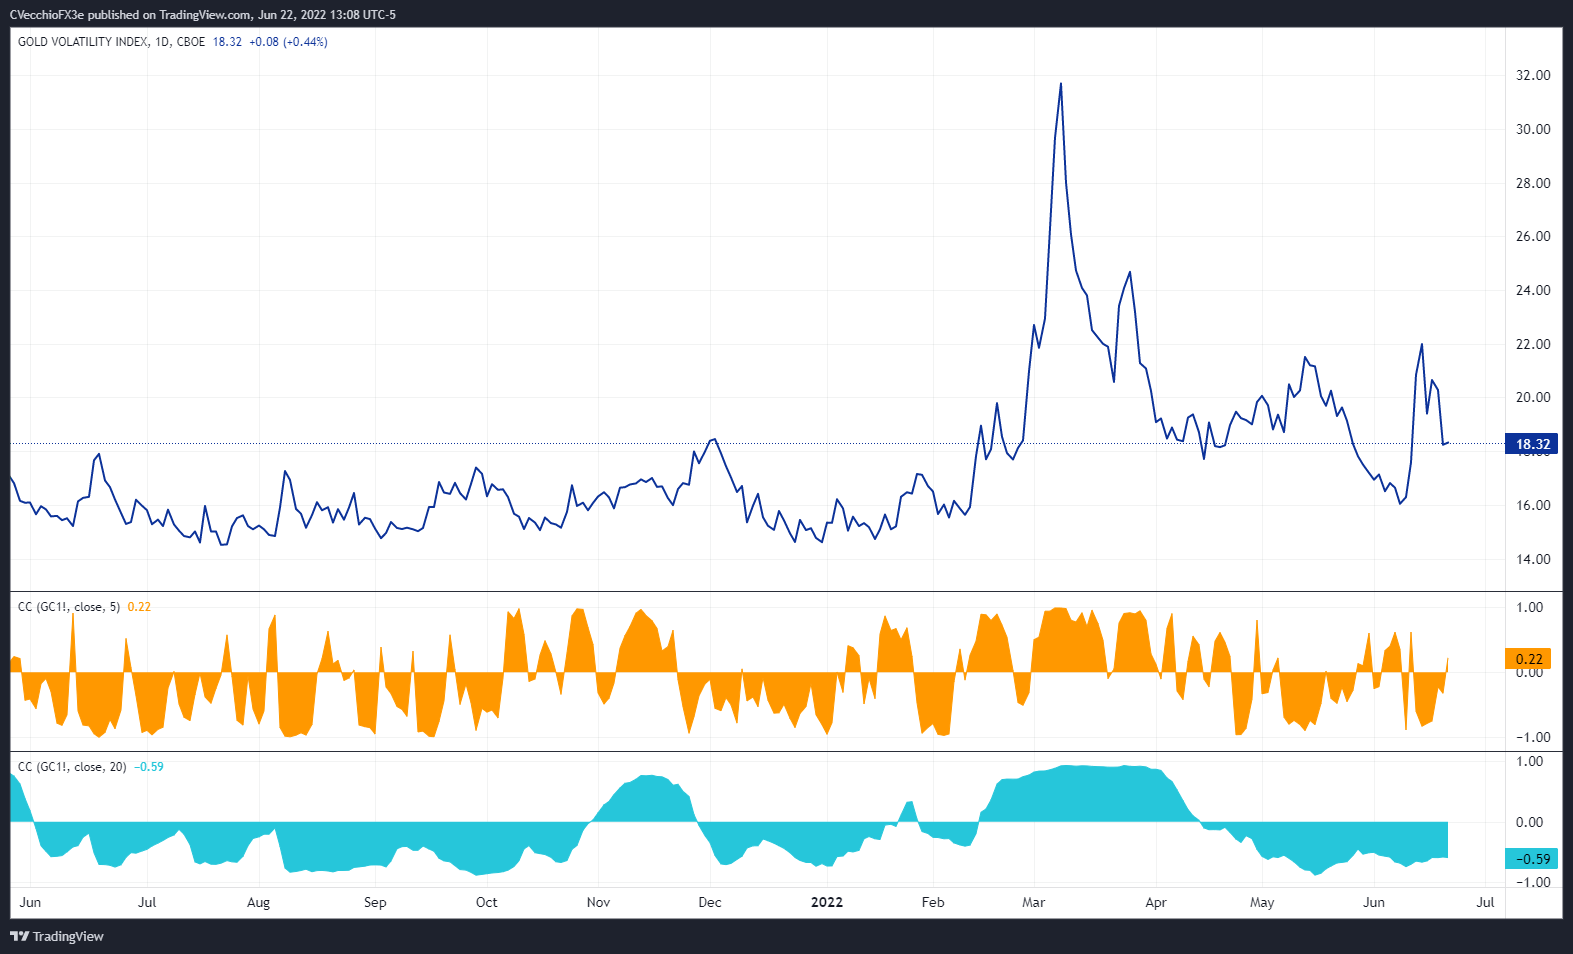
Gold volatility (as measured by the Cboe’s gold volatility ETF, GVZ, which tracks the 1-month implied volatility of gold as derived from the GLD option chain) was trading at 20.25 at the time this report was written. The 5-day correlation between GVZ and gold prices is +0.22 while the 20-day correlation is -0.59. One week ago, on June 15, the 5-day correlation was -0.79 and the 20-day correlation was -0.65.
Gold Price Rate Technical Analysis: Daily Chart (June 2021 to June 2022) (Chart 2)
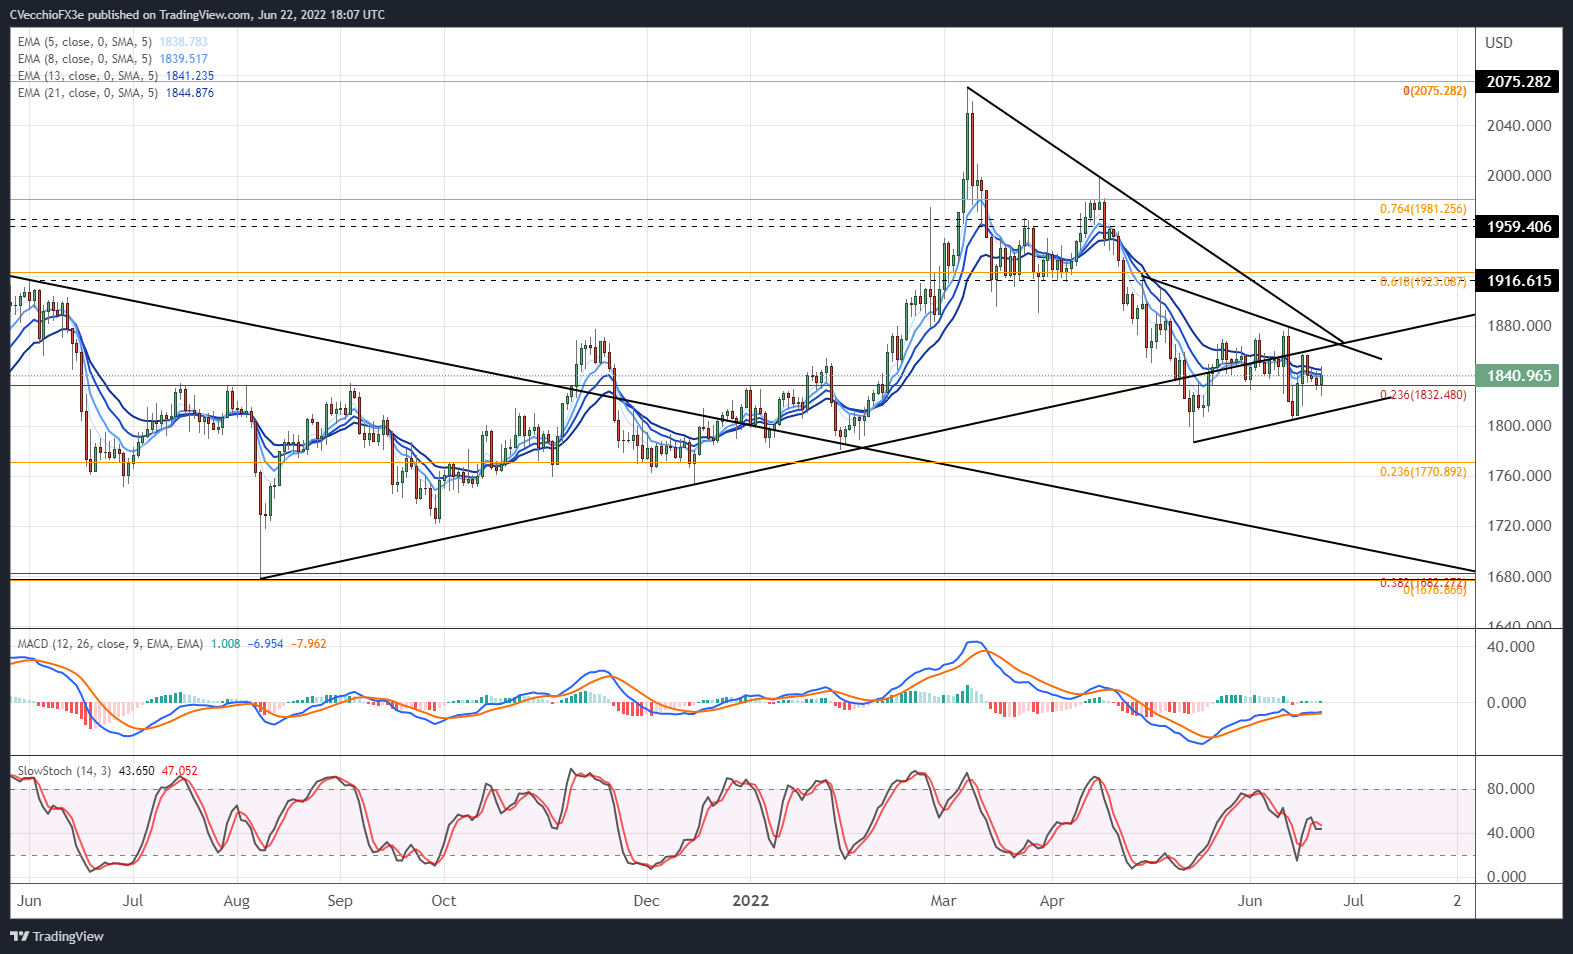
Gold prices continue to linger around the 23.6% Fibonacci retracement of the 2015 low/2020 high range at 1832.48. Context matters: price action persists beneath the uptrend from the August 2021, December 2021, and January 2022 lows; and the triangle has formed after a decline from the yearly highs.
Momentum is starting to take on a bearish hue. Gold prices are intertwined among their daily EMA envelope, which is still aligned in bearish sequential order. Daily MACD’s ascent below its signal line has started to fail, while daily Slow Stochastics have begun to turn lower. Another move lower may transpire soon, though the triangle dictates that it’s possible consolidation persists for a few more weeks.
Gold Price Technical Analysis: Weekly Chart (October 2015 to June 2022) (Chart 3)
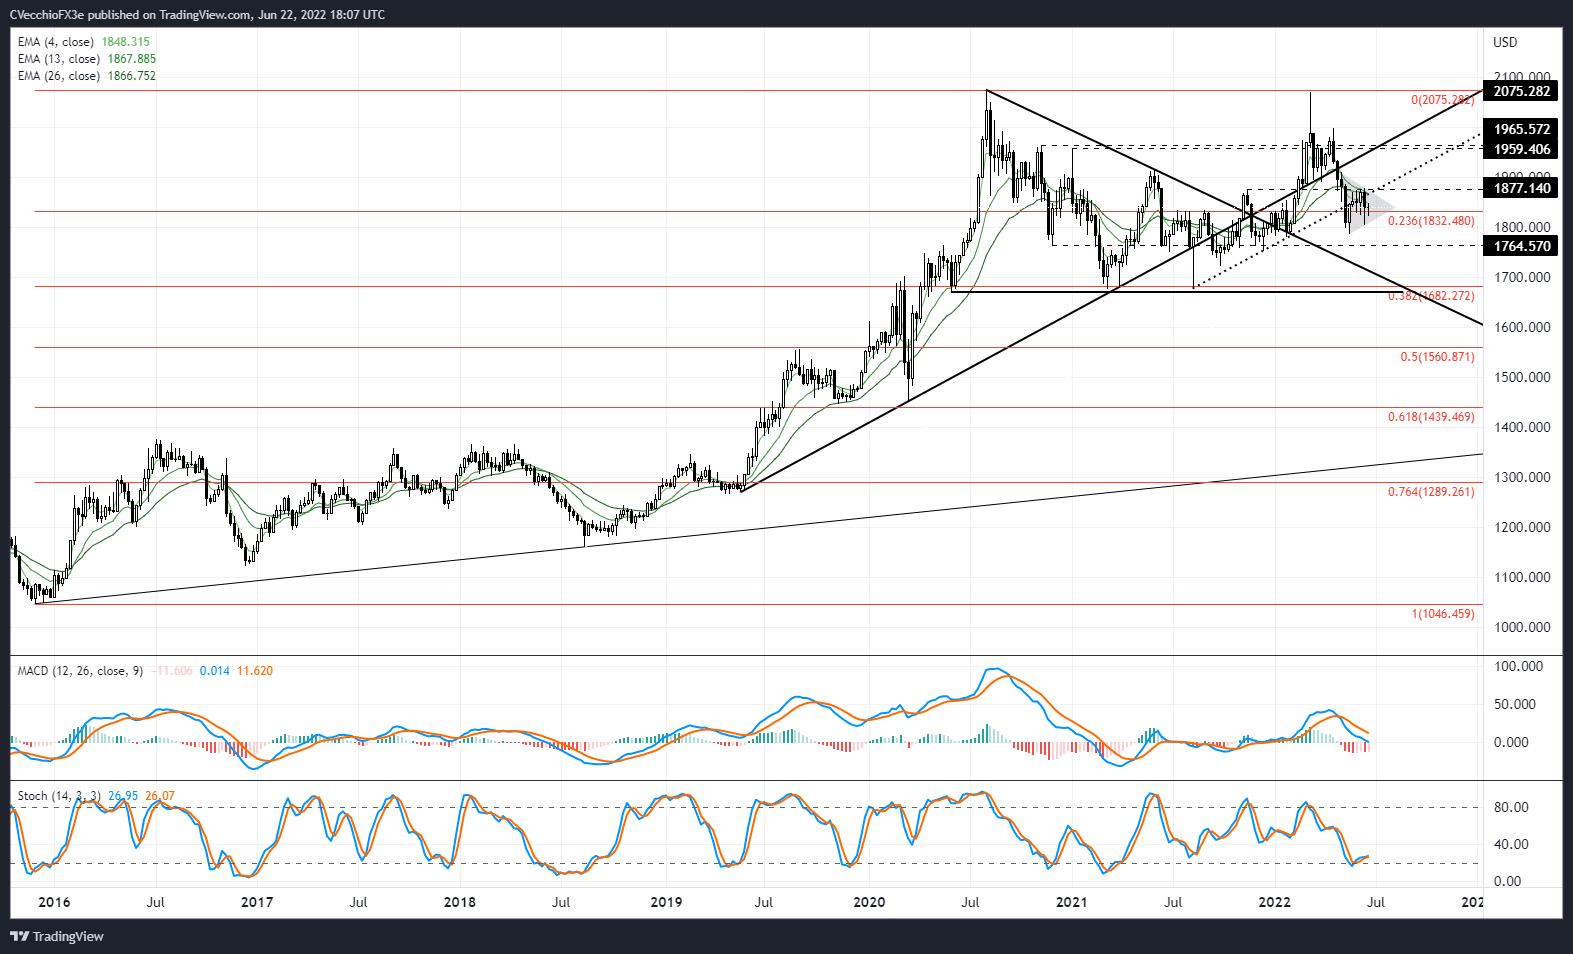
Nothing has changed longer-term. “The weekly timeframe continues to suggest that a double top is forming for gold prices, with the two peaks carved out by the August 2020 and March 2022 highs. Ever since the bearish outside engulfing bar on the weekly timeframe in late-April, gold prices have not been able to sustain a meaningful bid.” A drop below the June low of 1805.21 would increase the likelihood of a sustained move beneath 1800 over the next few months.

IG CLIENT SENTIMENT INDEX: GOLD PRICE FORECAST (June 22, 2022) (Chart 4)
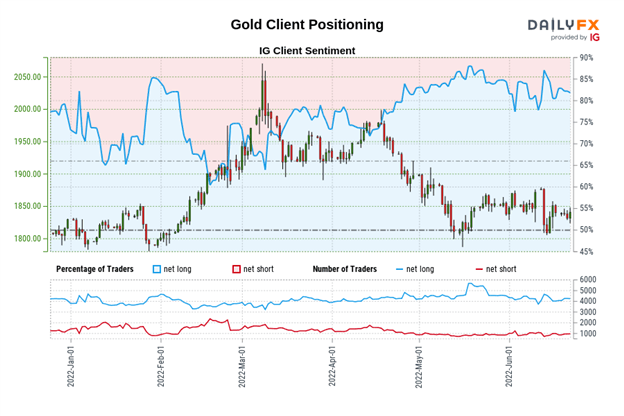
Gold: Retail trader data shows 80.56% of traders are net-long with the ratio of traders long to short at 4.14 to 1. The number of traders net-long is 3.55% lower than yesterday and 5.22% lower from last week, while the number of traders net-short is 5.98% lower than yesterday and 11.85% higher from last week.
We typically take a contrarian view to crowd sentiment, and the fact traders are net-long suggests Gold prices may continue to fall.
Positioning is more net-long than yesterday but less net-long from last week. The combination of current sentiment and recent changes gives us a further mixed Gold trading bias.
Trade Smarter - Sign up for the DailyFX Newsletter
Receive timely and compelling market commentary from the DailyFX team
--- Written by Christopher Vecchio, CFA, Senior Strategist


