


Gold Technical Price Outlook: XAU/USD Near-term Trade Levels
- Gold price updated technical trade levels – Daily & Intraday Charts
- XAU/USD monthly opening-range breakout to offer guidance
- New to Gold Trading? Get started with this Free How to Trade Gold -Beginners Guide
Gold prices have been in a tug-of-war over the past few weeks with XAU/USD carving out a well-defined range just above support. While the broader outlook remains weighted to the downside, a near-term recovery off the May lows remains constructive and we’re on the lookout for a breakout in the days ahead for guidance. These are the updated targets and invalidation levels that matter on the XAU/USD technical charts. Review my latest Strategy Webinar for an in-depth breakdown of this gold technical setup and more.
Gold Price Chart - XAU/USD Daily
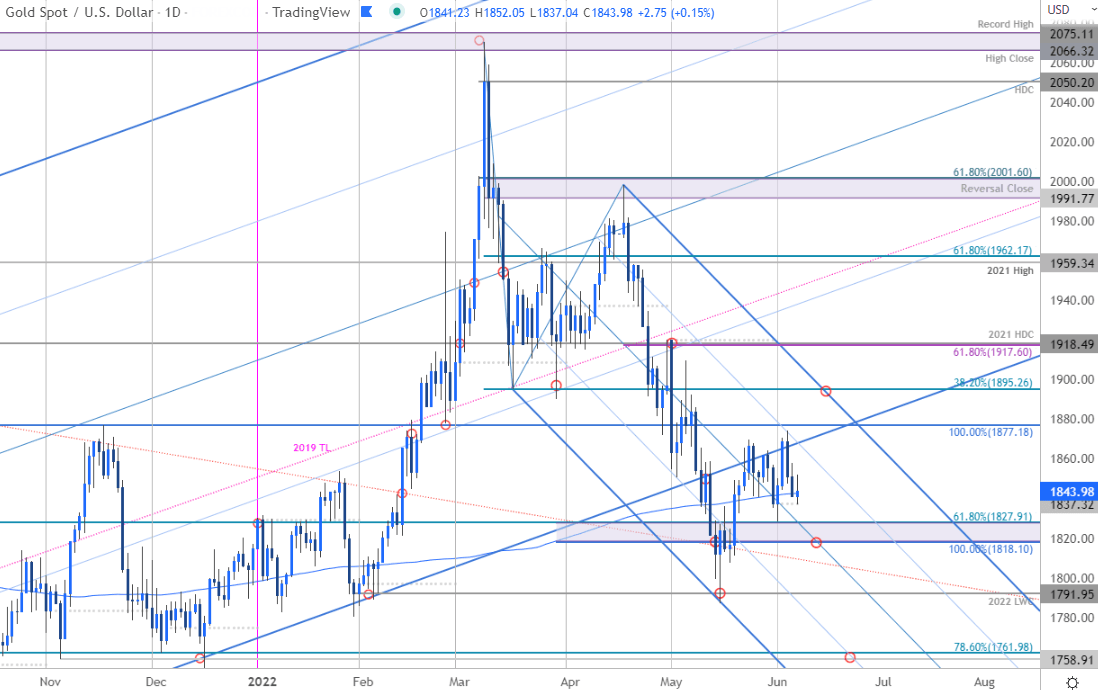
Chart Prepared by Michael Boutros, Technical Strategist; Gold on Tradingview
Technical Outlook: In last month’s Gold Price Outlook we highlighted that XAU/USD had rallied into downtrend resistance and, “failure to close above this threshold could mark resumption of the broader downtrend.” The rally was rejected at resistance again last week with price carving the June opening-range just above key support at 1818/27- a region defined by the 100% extension of the yearly decline and the 61.8% Fibonacci retracement of the 2021 advance. Look for the breakout in the days ahead to offer further guidance on our medium-term directional bias.
Gold Price Chart - XAU/USD 240min

Notes: A closer look at Gold price action shows XAU/USD trading within an embedded ascending pitchfork formation extending off the May / June lows with price testing the lower parallel today. A break below this formation would shift the focus back towards key support at 1818/27 – look for a larger reaction there IF reached with a break / daily close below needed to mark resumption towards the yearly low-week close at 1791 and November lows / 78.6% retracement at 1758/61. Weekly open resistance stands at 1851 backed by 1877. Ultimately, a breach / daily close above 1895/97 would be needed to suggest a more significant low was registered last month.

Bottom line: We’re looking for a breakout of the monthly opening-range for guidance in gold – 1827-1870. From a trading standpoint, the near-term focus remains constructive while within this formation but we’re on the lookout for an exhaustion high into broader downtrend resistance IF reached. Stay nimble into the close of the week with key US inflation data on Friday likely to fuel some volatility here. Review my latest Gold Weekly Price Outlook for a closer look at the longer-term XAU/USD technical trading levels.
For a complete breakdown of Michael’s trading strategy, review his Foundations of Technical Analysis series on Building a Trading Strategy
Gold Trader Sentiment – XAU/USD Price Chart
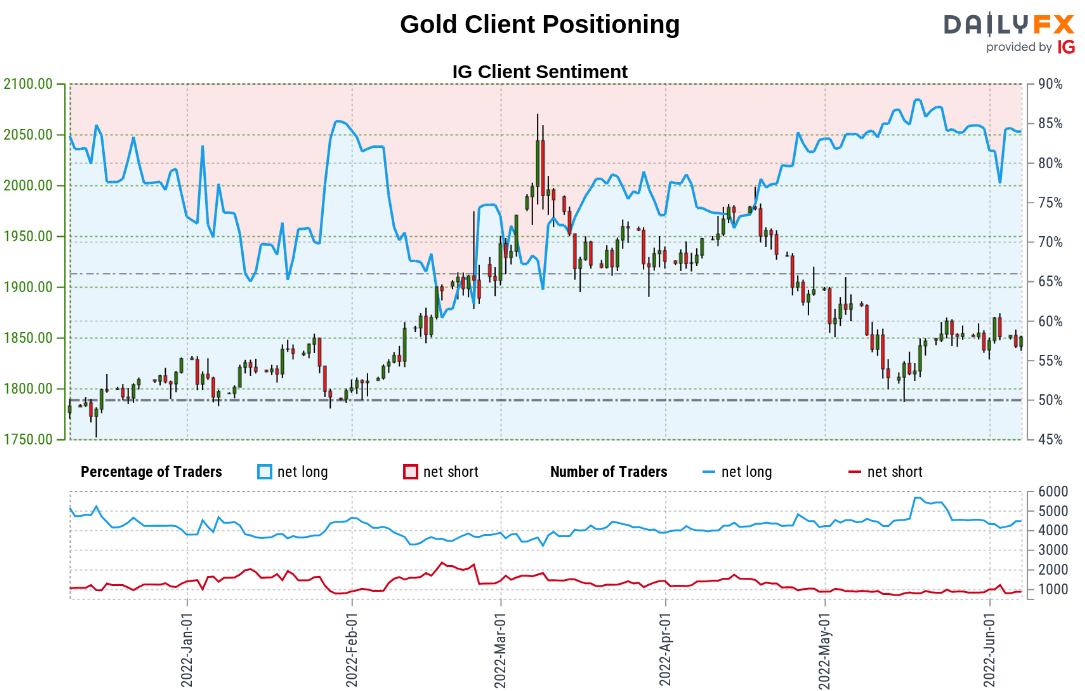
- A summary of IG Client Sentiment shows traders are net-long Gold- the ratio stands at +4.58 (82.09% of traders are long) – typically bearishreading
- Long positions are0.40% higher than yesterday and 1.50% lower from last week
- Short positions are9.28% higher than yesterday and 2.84% higher from last week
- We typically take a contrarian view to crowd sentiment, and the fact traders are net-long suggests Gold prices may continue to fall. Yet traders are less net-long than yesterday and compared with last week. Recent changes in sentiment warn that the current Gold price trend may soon reverse higher despite the fact traders remain net-long.
| Change in | Longs | Shorts | OI |
| Daily | 1% | -3% | -1% |
| Weekly | 2% | -8% | -2% |
Economic Calendar

Economic Calendar - latest economic developments and upcoming event risk.
Active Technical Setups
- EUR/AUD Technical Outlook: Five-Day Breakdown Testing Initial Support
- Canadian Dollar Technical Outlook: USD/CAD Plunges into Pivotal Range
- Yen Technical Outlook: USD/JPY Plunge Threatens Larger Correction
- EUR/USD Technical Price Outlook: Euro Rally at Risk into Resistance
- Written by Michael Boutros, Technical Strategist with DailyFX
Follow Michael on Twitter @MBForex


