


Gold Technical Price Outlook: XAU/USD Near-term Trade Levels
- Gold price updated technical trade levels – Daily & Intraday Charts
- XAU/USD breakout stalls at resistance – risk for exhaustion low heading into FOMC
- New to Gold Trading? Get started with this Free How to Trade Gold -Beginners Guide
Gold prices surged nearly 4% off the monthly lows with the breakout challenging initial resistance objectives ahead of today’s highly anticipated FOMC interest rate decision. While the broader technical outlook remains constructive, the immediate advance may be vulnerable here and we’re looking for possible price inflection in the days ahead. These are the updated targets and invalidation levels that matter on the XAU/USD technical charts heading into the Fed. Review my latest Strategy Webinar for an in-depth breakdown of this gold technical setup and more.
Gold Price Chart - XAU/USD Daily

Chart Prepared by Michael Boutros, Technical Strategist; Gold on Tradingview
Technical Outlook: In my last Gold Prices Outlook we noted that a breakout was imminent in XAU/USD and that a “breach / close above the July high-day close / 61.8% retracement / 2022 yearly open at 1829 is needed to mark resumption of the broader uptrend with such a scenario exposing subsequent resistance objectives at the median-line (currently ~1840) and the 2021 high-week close at 1849- look for a larger reaction there IF reached.” Gold ripped though resistance into the close of the week with price registering an intraday high at 1853 before pulling back to close just below the 1849 resistance target. We’re getting a bit o a pivot here and we’re on the lookout for possible downside exhaustion on this pullback.
Gold Price Chart - XAU/USD 240min

Notes: A closer look at Gold price action shows XAU/USD continuing to trade within the confines of the ascending pitchfork formation extending off the November / December low. An embedded channel off the January lows (red) has guided the recent advance with the lower parallel converging on initial support today at 1826/29- a region defined by the 61.8% Fibonacci retracement of the November decline, the July high-day close, and the 38.2% retracement of the January range. Near-term bullish invalidation now rests with at the lower parallel / 61.8% retracement at 1809- losses should be limited to this slope IF price is indeed heading higher. A topside breach from here keeps the focus on a pair of extensions at 1861 and 1877- both areas of interest for possible topside exhaustion IF reached.

Bottom line: The gold breakout is now probing initial resistance targets with the FOMC rate decision on tap. From a trading standpoint, a good region to reduce long-exposure / raise protective stops- look for an exhaustion low ahead of 1809 on pullbacks with a close above 1849 needed to keep the bulls in control. Stay nimble into the release and watch the daily / weekly close- we’re likely to get some volatility here. Review my latest Gold Weekly Price Outlook for a closer look at the longer-term XAU/USD technical trading levels.
For a complete breakdown of Michael’s trading strategy, review his Foundations of Technical Analysis series on Building a Trading Strategy
Gold Trader Sentiment – XAU/USD Price Chart
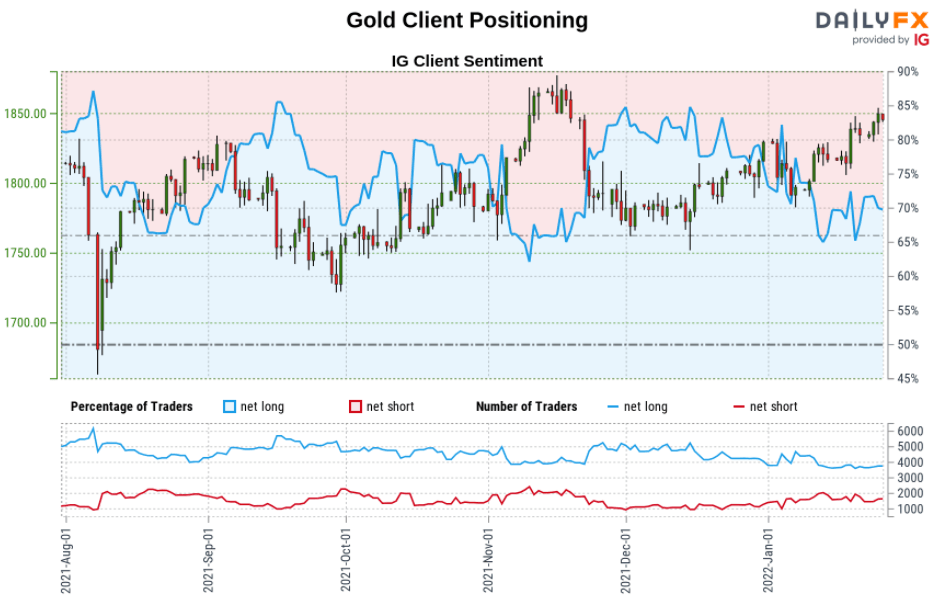
- A summary of IG Client Sentiment shows traders are net-long Gold- the ratio stands at +2.32 (69.86% of traders are long) – typically bearishreading
- Long positions are2.46% higher than yesterday and 0.28% lower from last week
- Short positions are2.96% higher than yesterday and 3.79% higher from last week
- We typically take a contrarian view to crowd sentiment, and the fact traders are net-long suggests Gold prices may continue to fall. Yet traders are less net-long than yesterday and compared with last week. Recent changes in sentiment warn that the current Gold price trend may soon reverse higher despite the fact traders remain net-long.
| Change in | Longs | Shorts | OI |
| Daily | 1% | -3% | -1% |
| Weekly | 2% | -8% | -2% |
---
Active Technical Setups
- Canadian Dollar Outlook: USD/CAD Threatens Breakout- BoC/Fed Levels
- Bitcoin Outlook: Bitcoin Battle Lines Drawn- BTC/USD Breakout Levels
- Written by Michael Boutros, Technical Strategist with DailyFX
Follow Michael on Twitter @MBForex


