


Gold Price Outlook:
- Last week’s bullish outside engulfing bar isn’t producing much by way of upside for gold prices.
- Failure to climb through 1800 after last week’s price action suggests a return towards recent range lows may be in the cards.
- According to the IG Client Sentiment Index, gold prices have a mixed bias in the near-term.

Technical Turnaround Failing
As COVID-19 omicron variant concerns have started to fade from global financial markets, gold prices are losing their relative appeal as a safe haven asset. US equity markets are rallying, US Treasury yields are higher, and inflation expectations continue to steady thanks to rates markets continuing to price in up to 150-bps worth of tightening from the Federal Reserve through the end of 2023. A disappointing development for bulls, last week’s bullish outside engulfing bar isn’t producing much by way of upside for gold prices; the best opportunity for a sustained rally above 1800 may have been lost.
Gold Volatility and Gold Prices’ Relationship Remains Inverted
Historically, gold prices have a relationship with volatility unlike other asset classes. While other asset classes like bonds and stocks don’t like increased volatility – signaling greater uncertainty around cash flows, dividends, coupon payments, etc. – gold tends to benefit during periods of higher volatility. Last week it was observed that “gold’s advance may prove limited if gold volatility thus continues to decline,” and indeed, the decline in gold volatility has proved to be an obstacle for further gold price gains.
GVZ (Gold Volatility) Technical Analysis: Daily Price Chart (December 2020 to December 2021) (Chart 1)
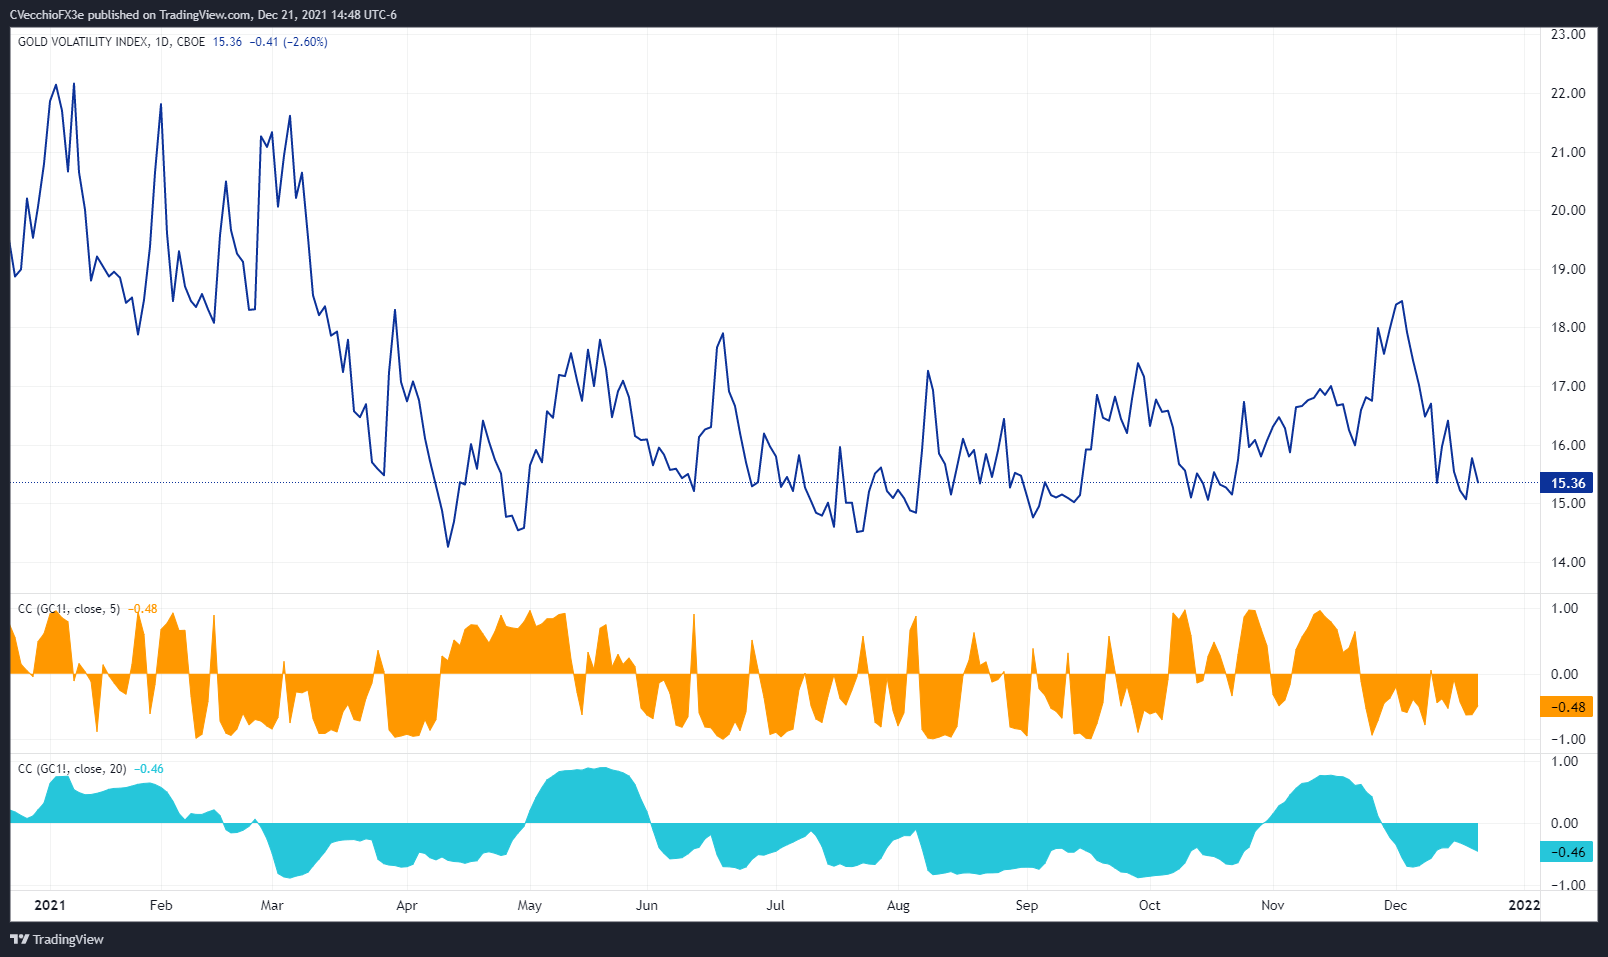
Gold volatility (as measured by the Cboe’s gold volatility ETF, GVZ, which tracks the 1-month implied volatility of gold as derived from the GLD option chain) was trading at 15.36 at the time this report was written. The relationship between gold prices and gold volatility continues to churn, as the 5-day correlation is becoming less negative while the 20-day correlation is becoming increasingly negative. The 5-day correlation between GVZ and gold prices is -0.48 while the 20-day correlation is -0.46. One week ago, on December 14, the 5-day correlation was -0.53 and the 20-day correlation was -0.40.
Gold Price Rate Technical Analysis: Daily Chart (December 2020 to December 2021) (Chart 2)
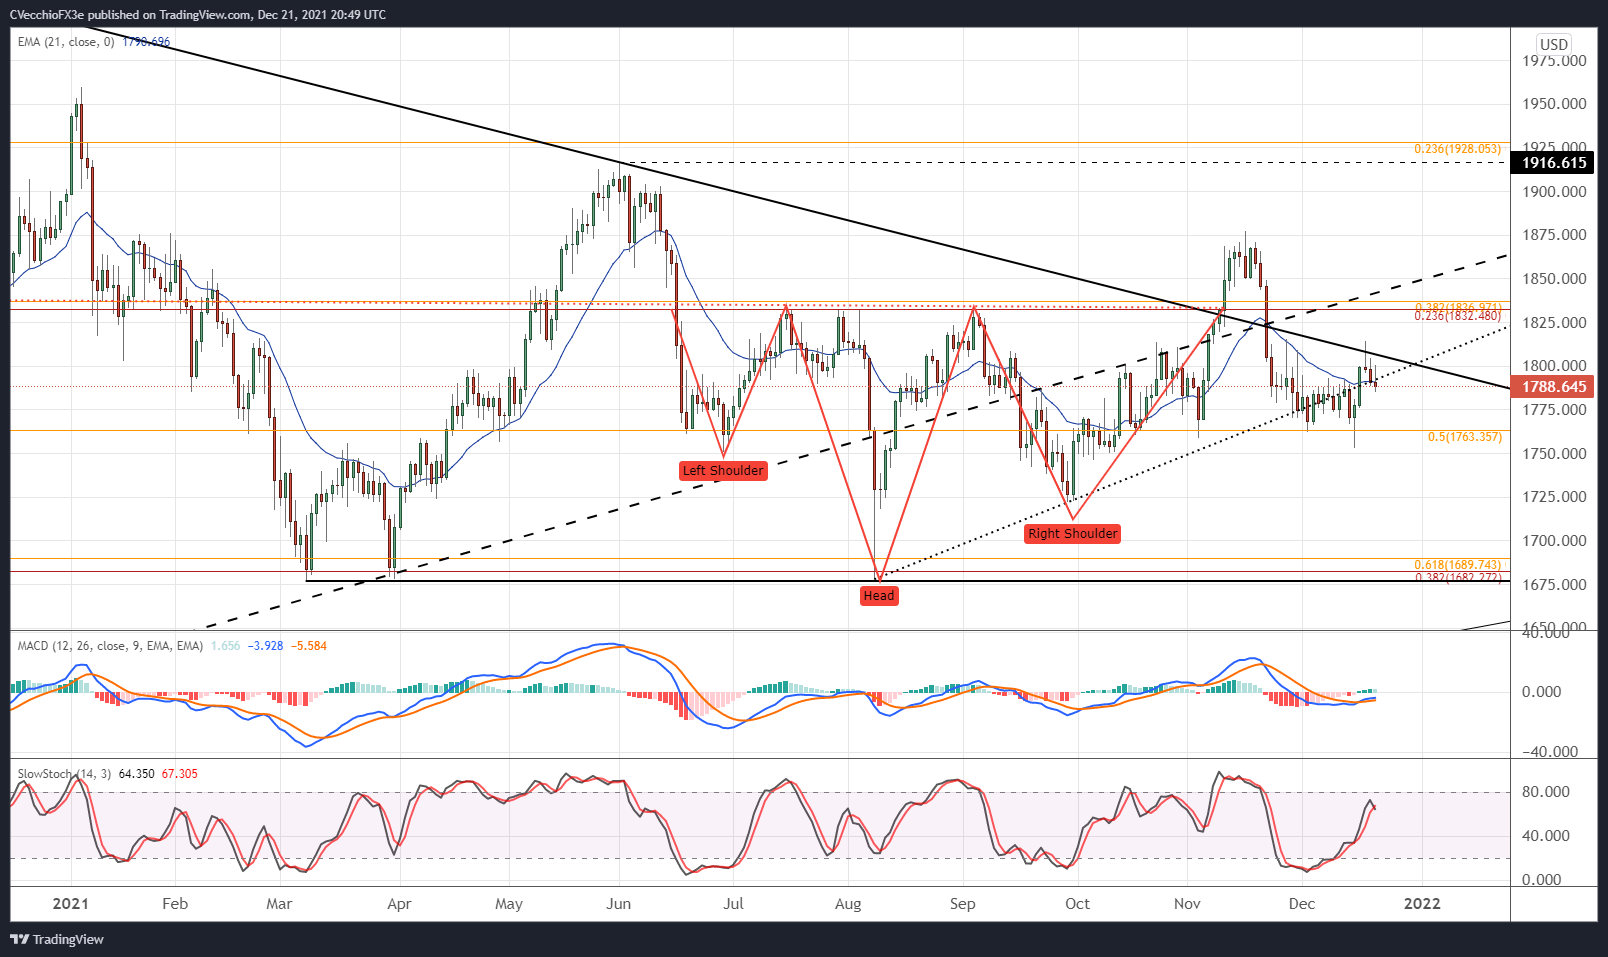
Gold prices have started to slip back below their daily 21-EMA, after another failed attempt to climb above the descending trendline from the August 2020 (all-time high) and June 2021 swing highs. Furthermore, gold prices have once again slipped below the uptrend from the August and September swing lows, hinting that the recent burst of activity higher has been exhausted. Daily MACD is beginning to turn lower while below its signal line, and daily Slow Stochastics have issued a bearish crossover after failing to reach overbought territory. More downside could prevail in the very near-term towards 1760.
Gold Price Technical Analysis: Weekly Chart (October 2015 to December 2021) (Chart 3)
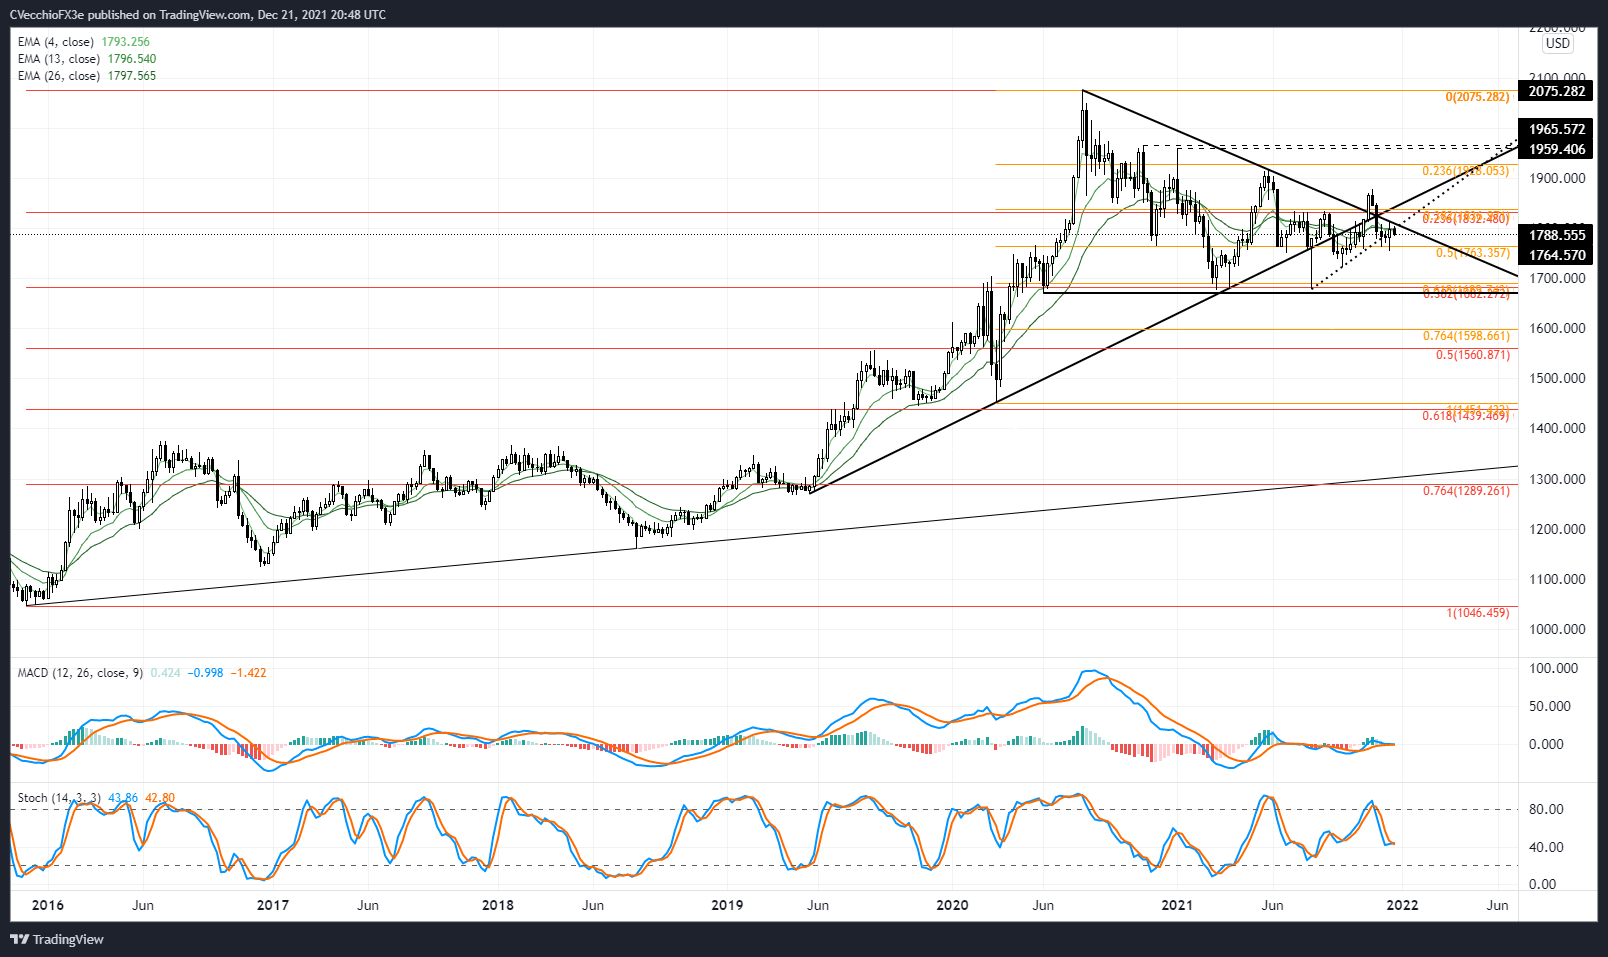
Last week it was noted “the weekly candle offers an even more bullish prognostication for gold prices. Should this weekly candle close above last week’s high of 1793.16, we would have a bullish outside engulfing bar in place, suggesting more upside in the very near-term.” However, there has been no follow through higher for gold prices; failure to build upon the weekly bullish outside engulfing bar in the near-term may harken a step back for gold prices. The weekly 4-, 8-, and 13-EMA envelope is flat, suggesting no momentum bias. Weekly MACD and weekly Slow Stochastics are both flat at their respective signal and median lines. More sideways chop may prevail through the end of the year, a downgrade in perspective relative to the prior update.

IG CLIENT SENTIMENT INDEX: GOLD PRICE FORECAST (December 21, 2021)

Gold: Retail trader data shows 82.53% of traders are net-long with the ratio of traders long to short at 4.73 to 1. The number of traders net-long is 6.19% higher than yesterday and 9.54% lower from last week, while the number of traders net-short is 20.64% lower than yesterday and 3.18% higher from last week.
We typically take a contrarian view to crowd sentiment, and the fact traders are net-long suggests Gold prices may continue to fall.
Positioning is more net-long than yesterday but less net-long from last week. The combination of current sentiment and recent changes gives us a further mixed Gold trading bias.
--- Written by Christopher Vecchio, CFA, Senior Strategist


