


Gold Price Outlook:
- Gold prices are overcoming technical resistance after barrage of central bank headlines over the past 24-hours.
- A return back above 1800 seems likely as long as the US Dollar remains on its backfoot; higher towards 1835 isn’t out of the question.
- According to the IG Client Sentiment Index, gold prices still have a bullish bias in the near-term.

Technical Turnaround
Gold prices sank to a new monthly low yesterday around the Federal Reserve rate decision, only to quickly reverse course and jump to fresh monthly highs. Yes, the Fed made a hawkish shift in near-term policy expectations as did the Bank of England with its rate hike, but markets aren’t necessarily reflecting a more hawkish disposition below the surface.
Longer-term growth expectations have come down reflecting anticipated higher borrowing costs, and the decline in long-end yields has actually seen real yields fall on both sides of the pond. Falling real yields are now curating an environment that allows for gold prices to rally, in line with seasonal tendencies (December has been the second best month of the year over the past 5-years).
Gold Volatility and Gold Prices’ Relationship Inversion Fading
Historically, gold prices have a relationship with volatility unlike other asset classes. While other asset classes like bonds and stocks don’t like increased volatility – signaling greater uncertainty around cash flows, dividends, coupon payments, etc. – gold tends to benefit during periods of higher volatility. Gold’s advance may prove limited if gold volatility thus continues to decline.
GVZ (Gold Volatility) Technical Analysis: Daily Price Chart (December 2020 to December 2021) (Chart 1)
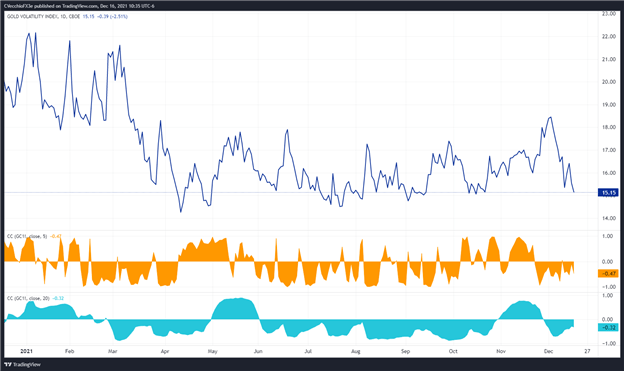
Gold volatility (as measured by the Cboe’s gold volatility ETF, GVZ, which tracks the 1-month implied volatility of gold as derived from the GLD option chain) was trading at 15.15 at the time this report was written, the lowest level seen since the end of October.
The relationship between gold prices and gold volatility is churning, insofar as the 5-day correlation is turning more negative while the 20-day correlation is losing its negative perspective. The 5-day correlation between GVZ and gold prices is -0.47 while the 20-day correlation is -0.32. One week ago, on December 9, the 5-day correlation was +0.05 and the 20-day correlation was -0.57.
Gold Price Rate Technical Analysis: Daily Chart (December 2020 to December 2021) (Chart 2)
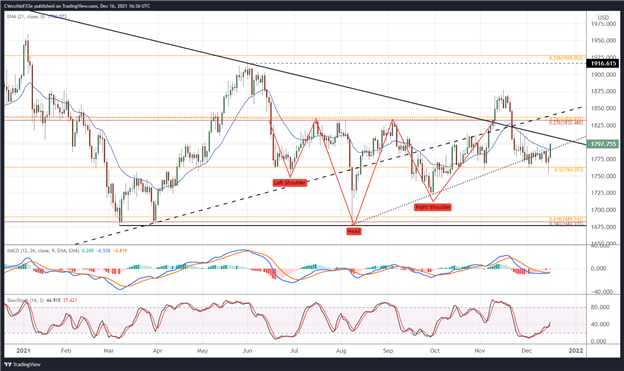
Gold prices were trading below the uptrend from the August and September swing lows through early-December, and the drop yesterday harkened a more significant pullback taking shape. But the bullish reversal that has developed over the past 24-hours has completely changed the tone. Yesterday’s hammer candle has seen follow through with a bullish piercing candle today, with gold prices trading above their daily 21-EMA in the process – the first time since November 22. A move towards 1805 (the descending trendline from the August 2020 and June 2021 highs) seems highly likely, and beyond there, a return to the summer highs established near 1835.
Gold Price Technical Analysis: Weekly Chart (October 2015 to December 2021) (Chart 3)
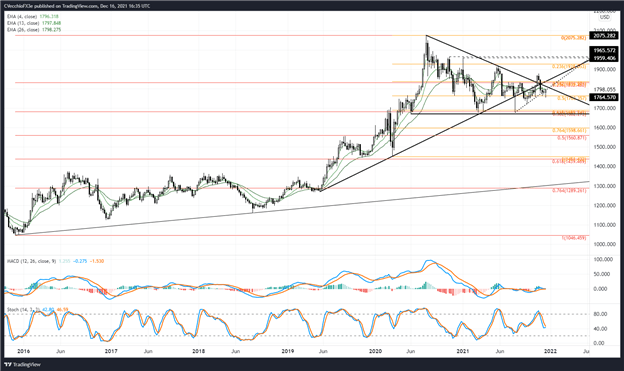
The weekly candle offers an even more bullish prognostication for gold prices. Should this weekly candle close above last week’s high of 1793.16, we would have a bullish outside engulfing bar in place, suggesting more upside in the very near-term. The weekly 4-, 8-, and 13-EMA envelope never quite turned negative, while weekly MACD is now turning higher at its signal line and weekly Slow Stochastics are reversing higher at their median line. The technical table has been set for gold prices to trade higher in the second half of December.

IG CLIENT SENTIMENT INDEX: GOLD PRICE FORECAST (December 16, 2021)
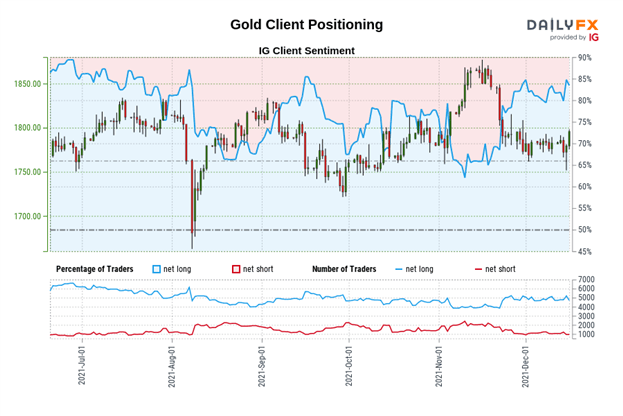
Gold: Retail trader data shows 80.20% of traders are net-long with the ratio of traders long to short at 4.05 to 1. The number of traders net-long is 13.40% lower than yesterday and 10.54% lower from last week, while the number of traders net-short is 10.18% higher than yesterday and 5.89% higher from last week.
We typically take a contrarian view to crowd sentiment, and the fact traders are net-long suggests Gold prices may continue to fall.
Yet traders are less net-long than yesterday and compared with last week. Recent changes in sentiment warn that the current Gold price trend may soon reverse higher despite the fact traders remain net-long.
--- Written by Christopher Vecchio, CFA, Senior Strategist


