


Gold Talking Points:
- Longer-term gold prices retain a bearish bias given the recent break of a bear flag formation.
- Shorter-term there remains bullish potential, with a setup resembling a messy inverse head and shoulders pattern to go along with a CPI print on Friday of this week.
- The analysis contained in article relies on price action and chart formations. To learn more about price action or chart patterns, check out our DailyFX Education section.

Gold prices have slowed the decline over the past few days after sinking below the bottom of a bear flag formation in late-November. Gold pushed down for a fresh low at 1761 last week but, since then, prices have started to push back into a prior level of resistance, taken from around the 1792 level on the chart.
This keeps gold prices in a bearish position, but with CPI set to be released on Friday, there remains potential for counter-trend breakout beyond the 1792 and perhaps even 1800 levels. Last month something similar happened, just after gold had started to test the lower trendline in the channel. When CPI printed at a whopping 6.2%, prices jumped up to the 1815 level before a slow burn developed until prices had bottomed out last week at 1761.
Gold Daily Price Chart
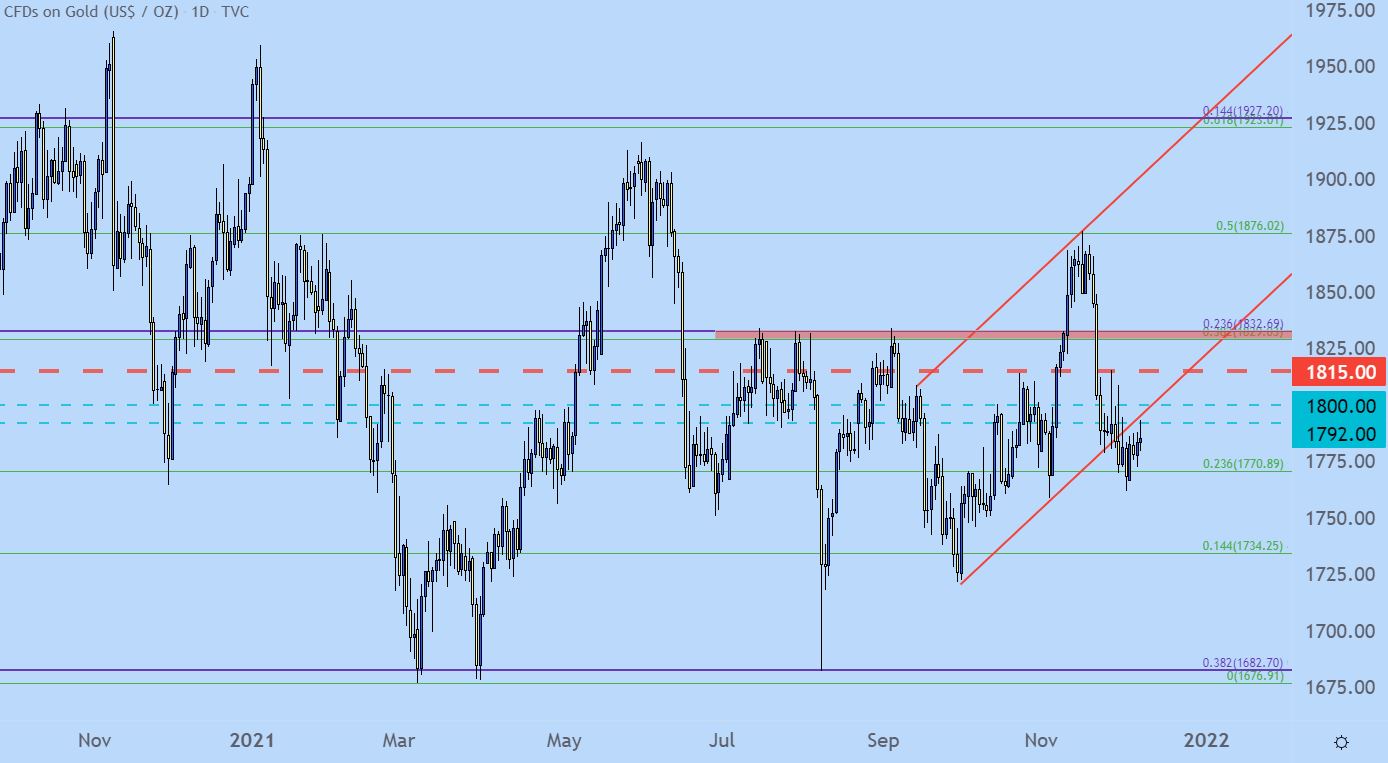
Chart prepared by James Stanley; Gold on Tradingview
The shorter time frame is what points to bullish breakout potential, and this is from a formation that appears to be taking on a similar shape to an inverse head and shoulders pattern. On Monday I highlighted a bullish engulfing pattern that pointed to a push higher, and this is what helped to bring on the resistance test at 1792, which has since held.
The price action has been messy so I wouldn’t quite say it qualifies as an inverse head and shoulders, but the same logic from that formation appears to be at play with 1792 functioning similar to a neckline that carries short-term bullish breakout potential.
This could support a run up to the 1800 psychological level or perhaps even as deep as 1815. But, at that point, the bearish side of the matter would begin to look attractive again, and this is what might allow for price action to breach the lows for a run at the 1680 level that’s now come in as support three different times in 2021 trade.
Gold Hourly Price Chart

Chart prepared by James Stanley; Gold on Tradingview
--- Written by James Stanley, Senior Strategist for DailyFX.com
Contact and follow James on Twitter: @JStanleyFX


