


Gold Talking Points:
- Gold prices have been relatively calm over the past few trading days, all factors considered.
- Ahead of that, however, was a massive move of weakness, fresh on the heels of Jerome Powell’s re-nomination to head the FOMC.
- The analysis contained in article relies on price action and chart formations. To learn more about price action or chart patterns, check out our DailyFX Education section.

It’s been a pretty eventful past few days in markets but, you might not know that by looking at Gold. With a new covid variant getting priced-in last week, bringing with it a massive dose of uncertainty, both stocks and the US Dollar put in a quick but sizable pullback. US Treasury yields similarly fell and those remain on their back foot today, which has helped stocks to recover. In Gold, however, prices are sitting on trendline support as part of a recently-built bear flag formation.
Gold Daily Price Chart
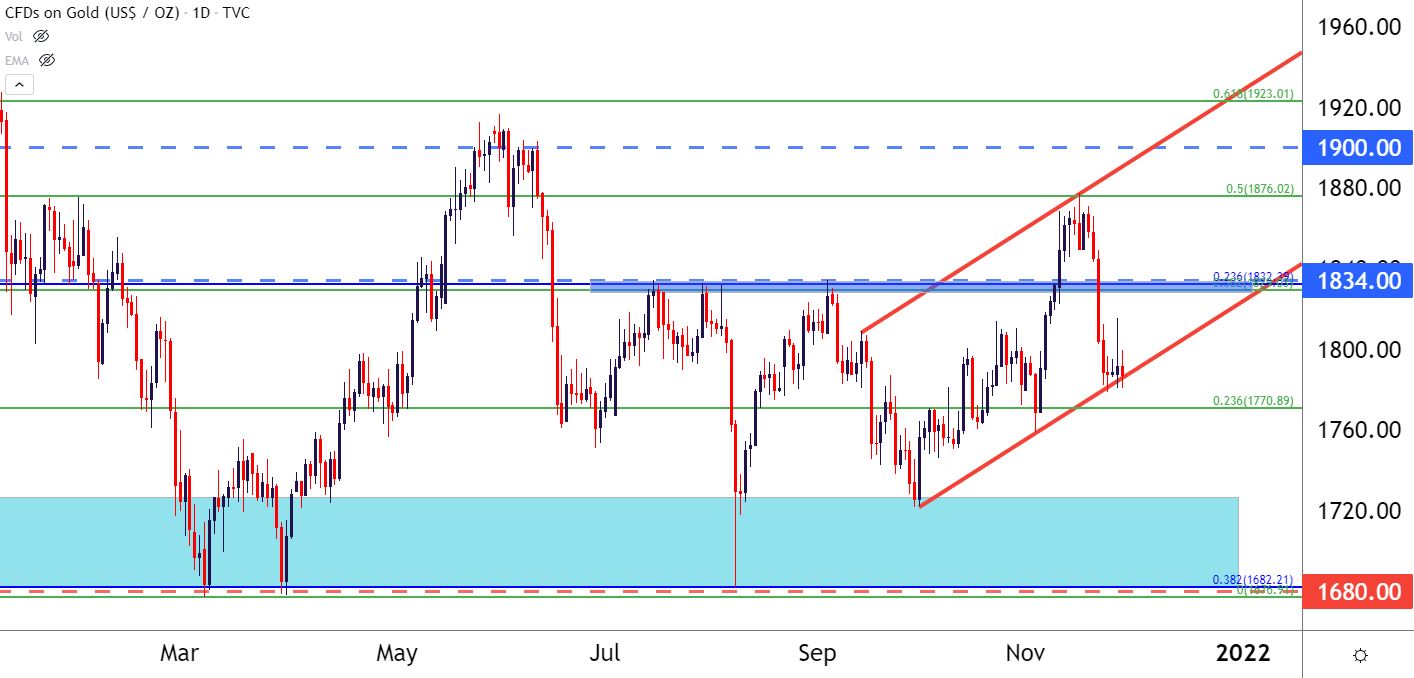
Chart prepared by James Stanley; Gold on Tradingview
Gold Levels
Should the trendline in gold begin to give way, there’s a nearby Fibonacci level around 1771 that’s of interest, but the prior price swing at 1759 is more interesting, and a breach below that opens the door for a move back towards the October low around 1721.
The big price level on Gold is 1680 – that’s the 2021 low and it’s already been tested three different times. If the bear flag resolves, that’s the price worthy of focus.
On the long side – there is some potential here, as well. As we’ve covered before, negative real rates are generally positive for Gold. So when inflation or inflation expectations are running higher but rates or rate expectations are not, Gold can shine. This is what had allowed for the prior bullish breakout, which showed up shortly after the 6.2% inflation print. That move has been mostly priced-out at this point with the bulk of the theme building early last week on news of Chair Powell’s re-nomination. But, the fundamental potential is there.
The technical positioning, however, is not. Gold would need to re-engage with the 1815 level to begin to open that door again.
Gold Four-Hour Price Chart
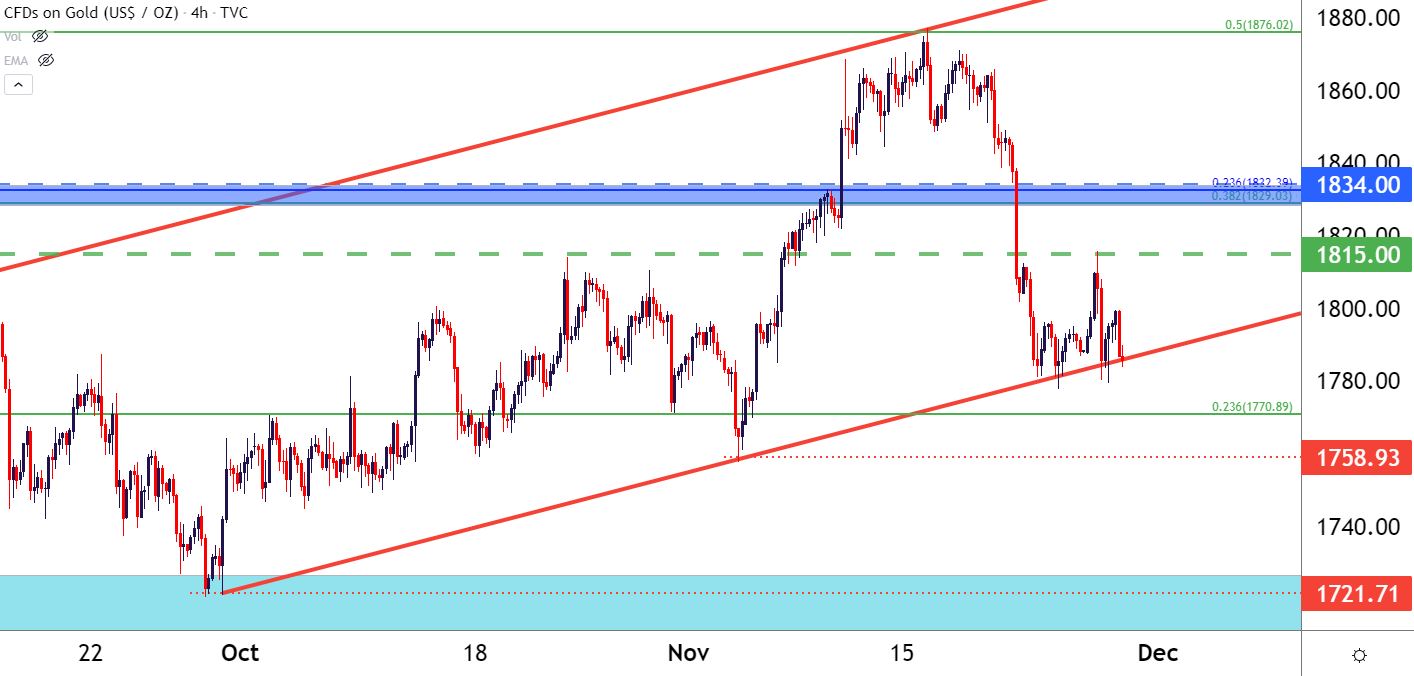
Chart prepared by James Stanley; Gold on Tradingview
--- Written by James Stanley, Senior Strategist for DailyFX.com
Contact and follow James on Twitter: @JStanleyFX


