


Gold Talking Points:
- Gold put in a massive incline after inflation printed at 30-year highs two weeks ago. But since then buying pressure has given way to sellers.
- Last week I highlighted a bear flag formation with resistance at a really big spot on the chart. That resistance has held and Gold has plummeted below a key spot of support potential at 1834.
- The analysis contained in article relies on price action and chart formations. To learn more about price action or chart patterns, check out our DailyFX Education section.

Gold prices are putting in an aggressively bearish move this morning, seemingly driving on the news that FOMC Chair Jerome Powell has been nominated for a second term. And while few would consider Chair Powell a ‘hawk,’ the fact that this move has printed so cleanly off of that headline indicates that it has something to do with Gold prices falling through the key support level at 1834.
Putting the pieces together and it would seem that Gold prices are dipping as Powell’s nomination has given more credence to the fact that inflation may be transitory in nature. This is what was keeping Gold prices capped throughout the summer even as inflation rates flew higher; and when Gold prices popped earlier in the month, it was after a dovish FOMC rate decision in which Chair Powell refused to opine on rates. And then the inflation print dropped a week later, allowing for Gold prices to run all the way up to Fibonacci resistance around 1870.
Gold Daily Price Chart
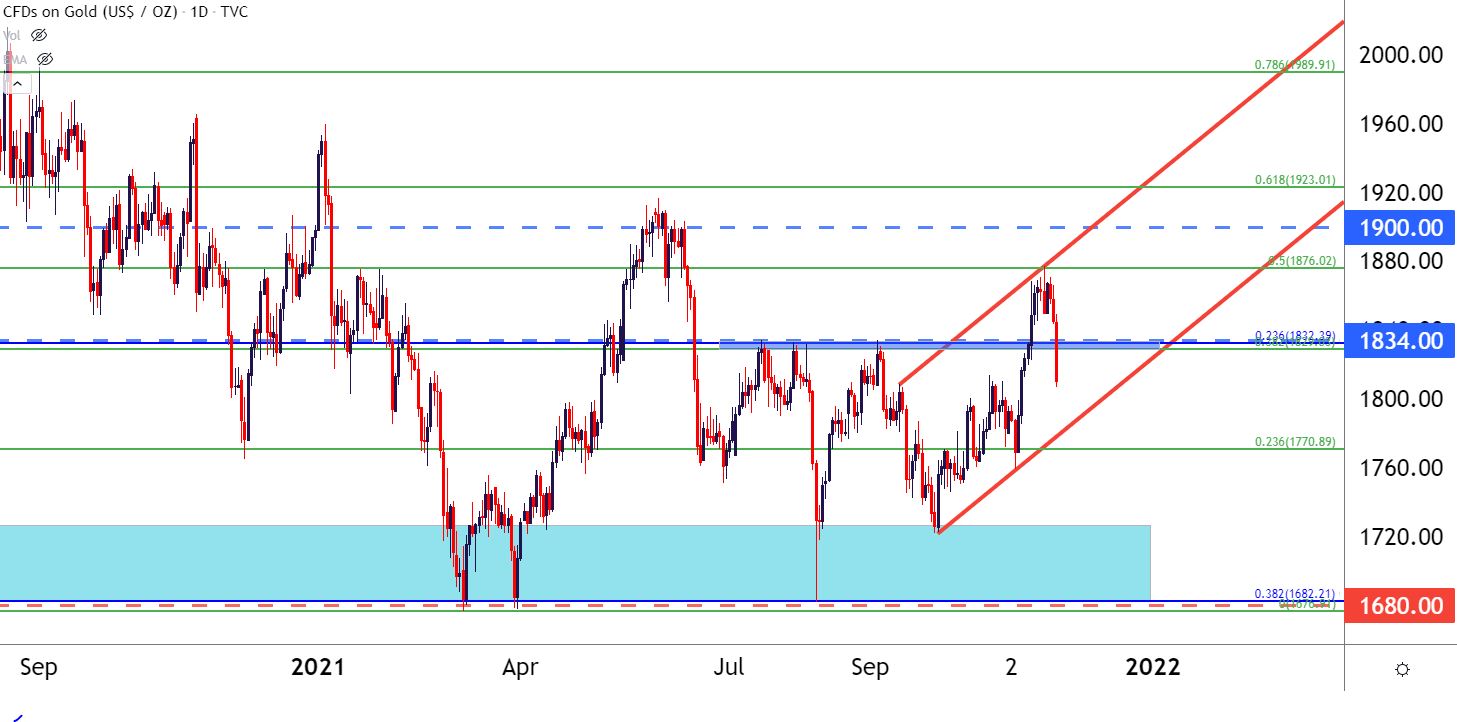
Chart prepared by James Stanley; Gold on Tradingview
Gold Longer-Term
The big question behind this bear flag is whether it can lead to another test of the 1680 level and, perhaps more importantly, a breach beyond that barrier of support. That zone around 1680, which is confluent with the 38.2% Fibonacci retracement of the 2018-2020 major move, has been tested thrice already in 2021, including the double bottom formation that had built in March and April.
On the way down, there’s another spot of potential support around 1771, which is the 23.6% retracement from the same Fibonacci study from which the 50% marker helped to set current resistance.
Gold Weekly Price Chart
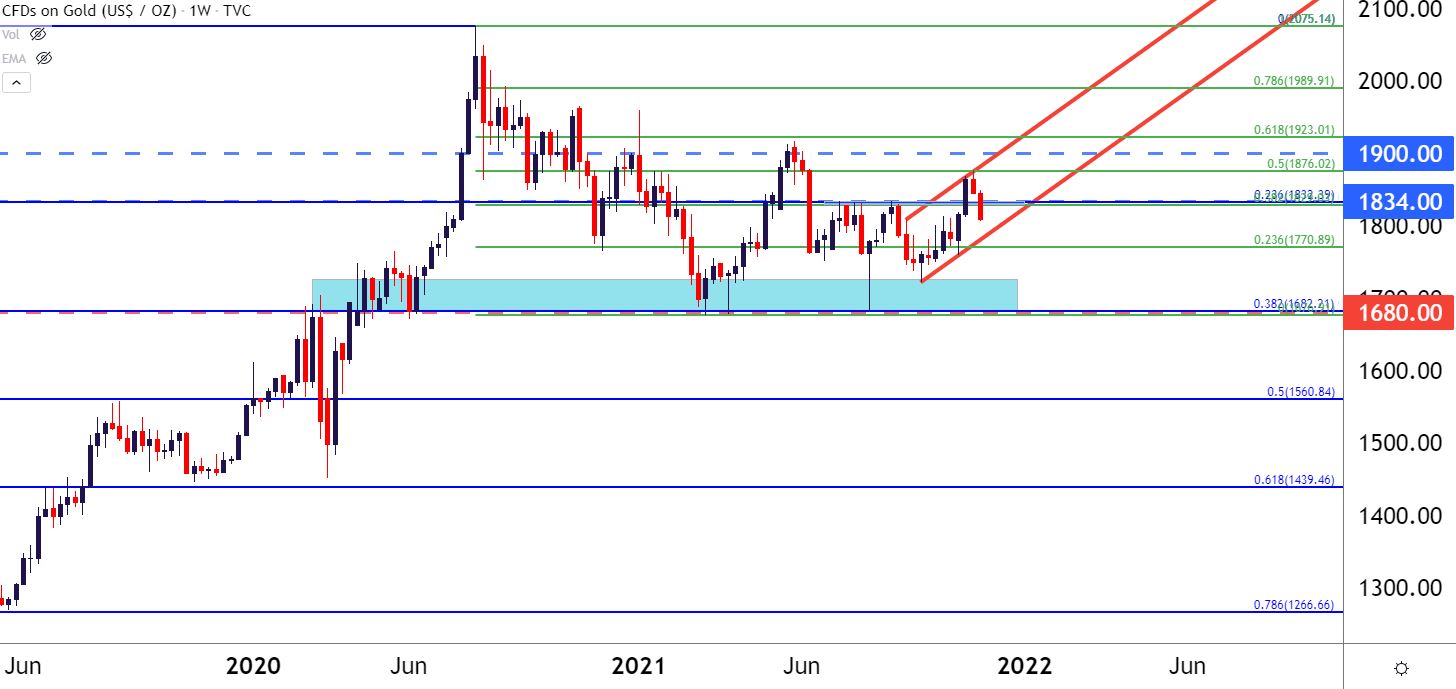
Chart prepared by James Stanley; Gold on Tradingview
Gold Short-Term
Given today’s bearish move combined with that brewing bear flag formation that I talked about last week, and we may be on the cusp of another fresh near-term trend. At this point, today’s lows are holding around a spot of prior resistance, taken from around the 1808 level on the chart.
The prior zone of potential support, taken from previous resistance around the 1834 handle, remains as possible lower-high resistance. But, if sellers are aggressive enough to post a new bearish trend, they may not be willing to wait around for a re-test of 1834. In that case, another spot of possible resistance can be scoped out around the 1821 level of prior swing support.
Gold Four-Hour Price Chart
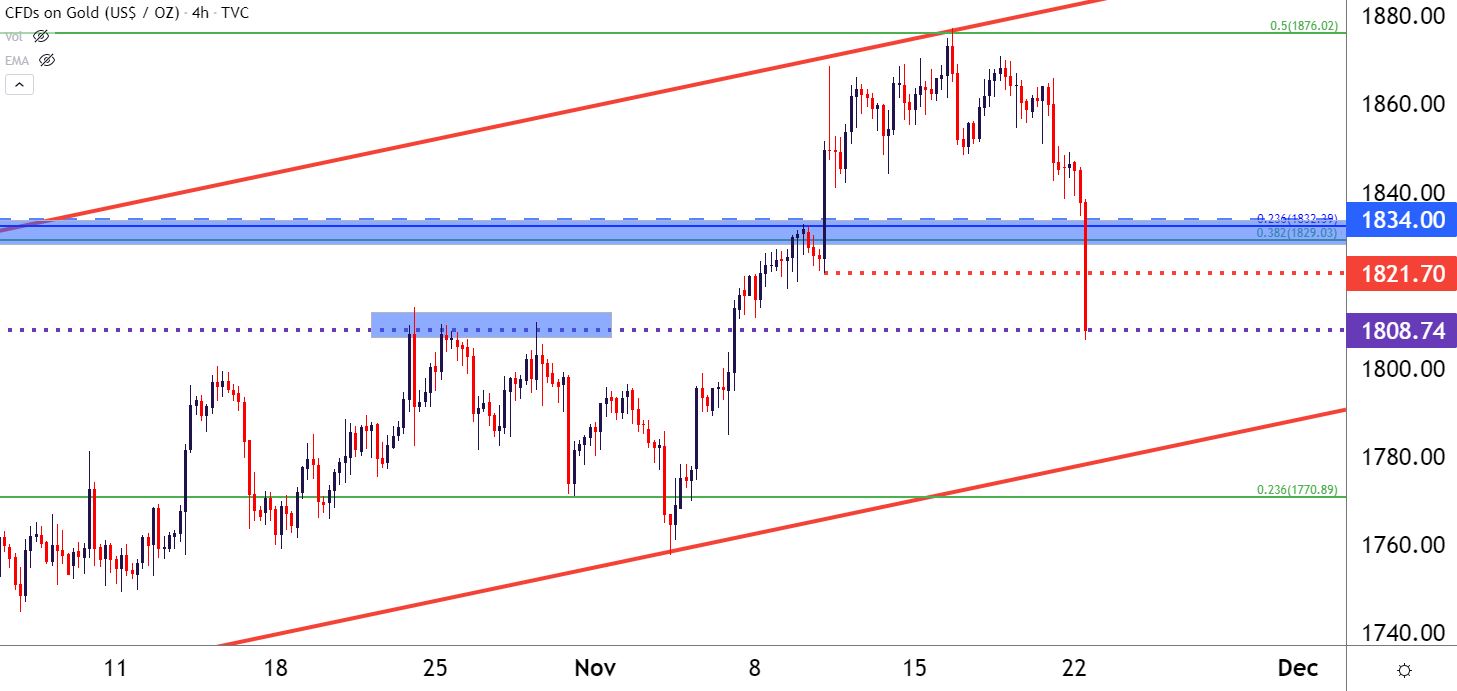
Chart prepared by James Stanley; Gold on Tradingview
--- Written by James Stanley, Senior Strategist for DailyFX.com
Contact and follow James on Twitter: @JStanleyFX


