


Gold Price Outlook:
- Falling US real yields and a weaker US Dollar are gilding the path higher for gold prices.
- Gold prices have already moved above 1810, and further gains above 1835 would put bullion in bullish breakout territory.
- According to the IG Client Sentiment Index, gold prices still have a bullish bias in the near-term.

Through the Headwinds
The narrative around gold prices is slowly but surely shifting. Last week, it was noted how gold prices had yet to make a significant technical drive higher. Now, on the back of a weaker US Dollar, thanks in part to falling Fed rate hike odds and plummeting US real yields, gold prices are moving closer to fulfilling their bullish potential originally discussed in mid-October (read: Gold Price Forecast: Nearing Long-term Trendline, Inverse Head and Shoulders Neckline - Levels for XAU/USD).
Although, according to seasonality studies, November has been the worst month of the year for gold prices, bullion is faring well as longer-term fundamental headwinds have abated in favor of encouraging short-term tailwinds. The potential inverse head and shoulders bottoming pattern first noted last month is now beginning to take shape. The technical picture now looks promising once again, giving traders a reason to embrace long gold positions.
Gold Volatility and Gold Prices’ Typical Relationship
Historically, gold prices have a relationship with volatility unlike other asset classes. While other asset classes like bonds and stocks don’t like increased volatility – signaling greater uncertainty around cash flows, dividends, coupon payments, etc. – gold tends to benefit during periods of higher volatility. Gold volatility edging higher has been met with higher gold prices, which is a promising near-term development.
GVZ (Gold Volatility) Technical Analysis: Daily Price Chart (November 2020 to November 2021) (Chart 1)

Gold volatility (as measured by the Cboe’s gold volatility ETF, GVZ, which tracks the 1-month implied volatility of gold as derived from the GLD option chain) was trading at 16.74 at the time this report was written.
The relationship between gold prices and gold volatility appears typical relative to historic norms, with the 20-day correlation holding near its strongest level since early-June. The 5-day correlation between GVZ and gold prices is +0.69 while the 20-day correlation is +0.65. One week ago, on November 2, the 5-day correlation was -0.49 and the 20-day correlation was +0.28.
Gold Price Rate Technical Analysis: Daily Chart (May 2020 to November 2021) (Chart 2)

For the past two weeks, we’ve noted that “as trading is a function of both price and time, the ascending trendline from the May 2019, March 2020, and March 2020 now resides closer to 1810 as key resistance. In the event that gold prices are able to clear this hurdle, it could be a quick trip upwards to the swing highs established over the summer near 1835, which constitutes the neckline of an inverse head and shoulders pattern that’s potentially been forming since June.”
Even though gold prices have a “dreadful seasonal backdrop suggests that November may not be the month to clear the aforementioned technical hurdles,” the shift in short-term fundamental factors has been significant enough to put the bullish breakout perspective back in focus.
Gold prices are above their daily 5-, 8-, 13-, and 21-EMA envelope, which is in bullish sequential order. Daily MACD is rising while above signal line, and daily Slow Stochastics have entered overbought territory. All of these technical indicators point to strong bullish moment.
While it’s been previously suggested that “until 1835 is achieved, then there is no sound technical reason to believe that gold prices have bottomed.” We could be on the cusp of gold prices clearing 1835, which would put into focus a major near-term bottom with gains eyed over the coming months.
Gold Price Technical Analysis: Weekly Chart (October 2015 to November 2021) (Chart 3)

Gold prices’ technical structure on the weekly timeframe is slowly shifting towards a more bullish directional bias. The weekly 4-, 13-, and 26-EMA envelope’s slope has started to take a positive tilt, suggesting burgeoning bullish momentum. Weekly Slow Stochastics are entering overbought territory for the first time since late-May, and weekly MACD is climbing above its signal line. While it thus remains the case that “with a triangle continuing to take shape (starting in June 2020), it appears that the sideways shuffle in gold prices is set to continue for the foreseeable future, unless the 1835 level is broken,” the 1835 level may soon be broken warranting a shift in the longer-term outlook from neutral to bullish.

IG CLIENT SENTIMENT INDEX: GOLD PRICE FORECAST (November 9, 2021) (CHART 4)
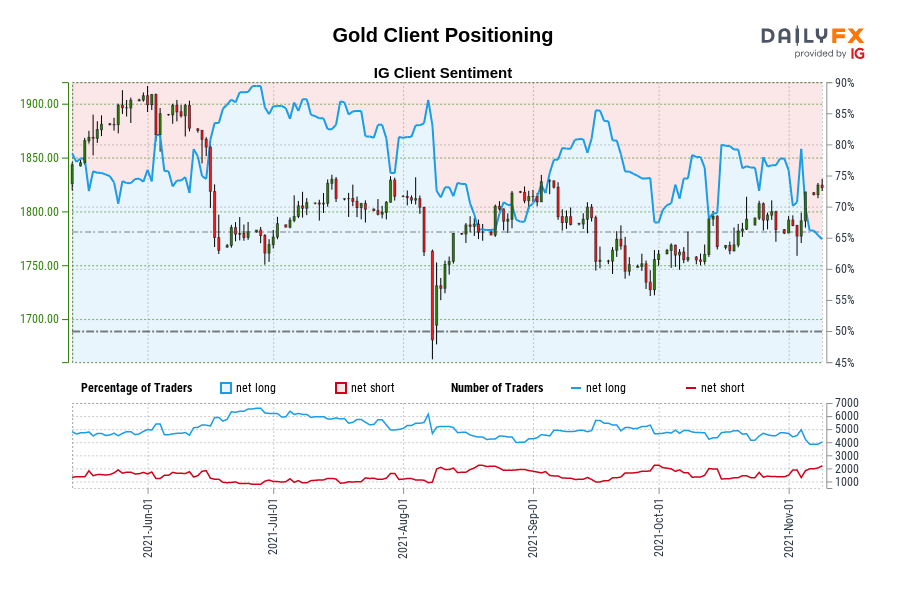
Gold: Retail trader data shows 63.10% of traders are net-long with the ratio of traders long to short at 1.71 to 1. The number of traders net-long is 0.88% lower than yesterday and 8.43% lower from last week, while the number of traders net-short is 13.50% higher than yesterday and 20.23% higher from last week.
We typically take a contrarian view to crowd sentiment, and the fact traders are net-long suggests Gold prices may continue to fall.
Yet traders are less net-long than yesterday and compared with last week. Recent changes in sentiment warn that the current Gold price trend may soon reverse higher despite the fact traders remain net-long.
--- Written by Christopher Vecchio, CFA, Senior Strategist


