


Gold, GLD, GC Talking Points:
- Gold prices are back to near-term resistance in the prior support zone of 1804-1808, and looming above is a really big level at 1834 that’s now turned around four bullish advances in the past few months.
- Long-term gold prices continue to trade in a bull flag formation and given the volatility pattern showing in August trade, the door remains open to topside breakout potential.
- The analysis contained in article relies on price action and chart formations. To learn more about price action or chart patterns, check out our DailyFX Education section.
Gold prices have continued to coil into another week, but that hardly tells the story of what’s going on here.
There’s rampant debate about when/if/how the Fed is going to begin tapering asset purchases and the backdrop hasn’t exactly been quiet with the delta variant and Afghanistan all producing some risk factors on the horizon. Gold prices have been seeing two-way-volatility on the back of this constant risk conundrum, and the entire outlay produces a number of questions around economic viability of the current recovery.
Another risk factor popped up last week with what’s happening in China with Evergrande, producing another possible item of concern as Central Banks look to start lifting off of the uber-accommodation that’s become commonplace over the past 18 months. On that topic, we’ll hear from the Fed next week and at this point the basic steps have been laid to allow for the bank to put forth a plan for how they’re looking to taper asset purchases. The big question is when this will be announced, when it will actually begin and by how much is the Fed looking to taper each month?
This announcement may come next week. At Jackson Hole and in the meeting minutes from the July FOMC rate decision, it was clear that most members of the Fed thought they’d be able to start tapering asset purchases this year. But, that was before the rise of Delta, the fall of Afghanistan and the emergence of Evergrande. And also, there was a pitiful NFP report released earlier this month and in that Jackson Hole speech, Chair Powell pointed to the labor market as the sore spot that the Fed was focusing on.
So, this may have delayed those plans. But next week’s FOMC is lining up to be a big one and Gold prices appear to be positioning for that in advance.
Gold Four-Hour Price Chart
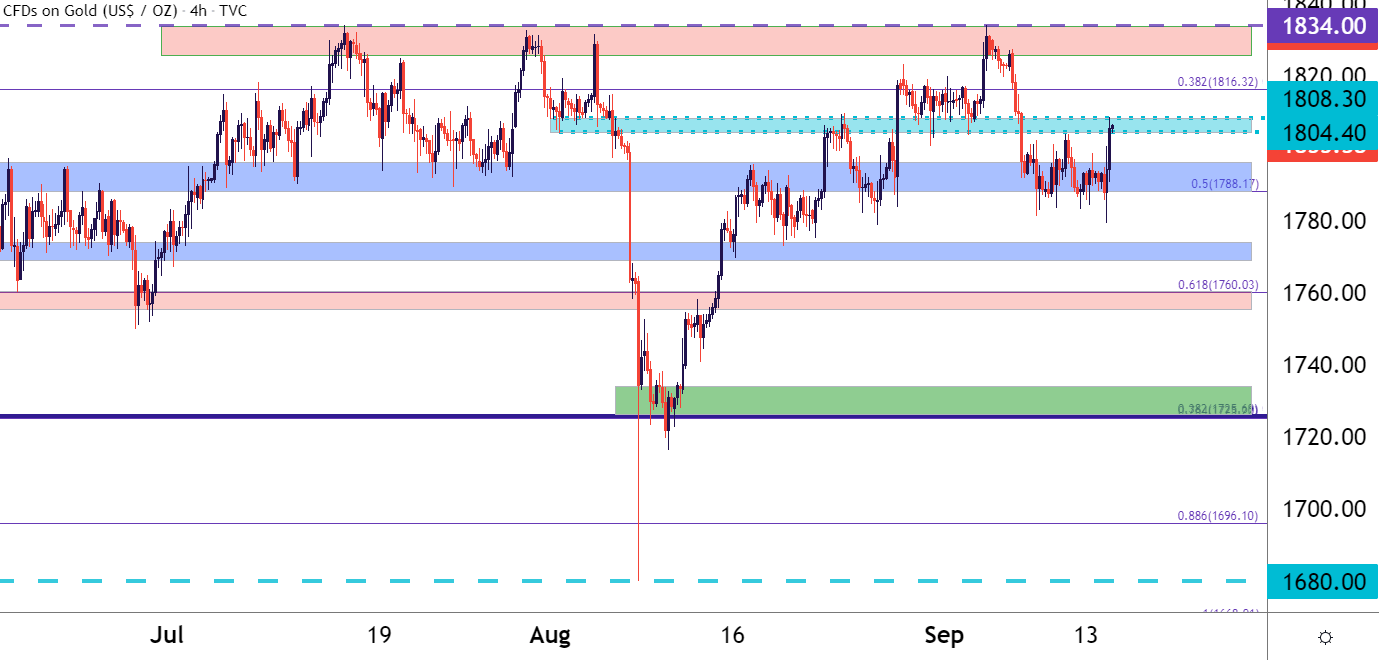
Chart prepared by James Stanley; Gold on Tradingview
Gold: From Flash Crash to False Breakout
The month of August was particularly pensive for Gold prices. It started with a ‘flash crash’ that saw price action push down to the 2021 low at 1680. But, the next few weeks showed recovery and prices rocketed right back to a resistance area at 1834. That area had previously held three different test and buyers were unable to breakout; with the August test being a fourth failed attempt to take that level out.
But, as prices pulled back from that failed break, support showed up at a familiar area, plotted around the 1780 figure, and that held through most of last week and into this week. On the back of this morning’s CPI release, prices are pushing up to a short-term resistance area, as taken from prior support, plotted from 1804-1808.
This keeps the door open for short-term breakout potential, and that exposes resistance levels at 1816 and then 1834 as the next topside objectives.
Gold Two-Hour Price Chart

Chart prepared by James Stanley; Gold on Tradingview
Gold: The Long-Term Points to Bullish Bias
With so much noise on shorter-terms, taking a step back can be helpful. From the Daily chart below, I’m looking at the bull flag formation – which does remain in-play. There’ve been numerous tests and possible negations of this formation but, to date, each has held up.
In March, it looked like the channel was going to give way. It didn’t, and instead, a double bottom formation built in that gave way to a bullish breakout in April.
With the ‘flash crash’ test of 1680 in August, which was confluent with the mid-line of the formation, price action is putting in what looks like an inverse head and shoulders pattern. It’s a messy setup so I wouldn’t quite call this an inverse head and shoulders, but given the repeated resistance at the 1834 level, which would be the neckline, the bullish breakout potential from the formation meshes with the longer-term setup in the bull flag.
Gold Daily Price Chart

Chart prepared by James Stanley; Gold on Tradingview
--- Written by James Stanley, Senior Strategist for DailyFX.com
Contact and follow James on Twitter: @JStanleyFX


