


Gold Price Talking Points:
- Gold prices have put in a strong move so far in April, highlighting the potential return of bullish price action.
- Gold prices have been mired in an 8-month pullback, taking on the form of a bull flag with a 38.2% Fibonacci retracement of the prior topside move. After a double bottom built in March, might bulls be able to re-ignite that upward trend?
- The analysis contained in article relies on price action and chart formations. To learn more about price action or chart patterns, check out our DailyFX Education section.
It’s been a long eight months for Gold bulls. The yellow metal topped-out on August 7th of last year, fresh on the heels of a meteoric run helped along by some loose yet aggressive Central Bank policy. Gold prices moved into deep overbought states but just continued to push, taking out the 2k psychological level for the first time ever and soon setting a fresh all-time-high at $2,075.
But, the same day of that new all-time-high also saw the build of a bearish engulfing candlestick on the Daily chart. And as weird as it felt , when penning the forecast for that weekend I highlighted the fact that a pullback may finally be brewing given the read of that bearish engulf.
And now here we are, eight months later, and that high from last year seems a distant water mark. In the time since, that pullback in Gold started to take on the form of a reversal, with some aggressive short-term price action showing as Gold prices pushed lower. But, as I discussed a couple of weeks ago, with some perspective, that eight months of pullback/coiling can be qualified as a corrective move in what may be a bigger-picture, longer-term trend.
On the below weekly chart, I’m focusing in on that pullback, and notice how it’s so far taken on the form of a bull flag formation, which would also point to the possibility of longer-term bullish behavior here.
To learn more about bull flag formations, check out DailyFX Education
Gold Weekly Price Chart
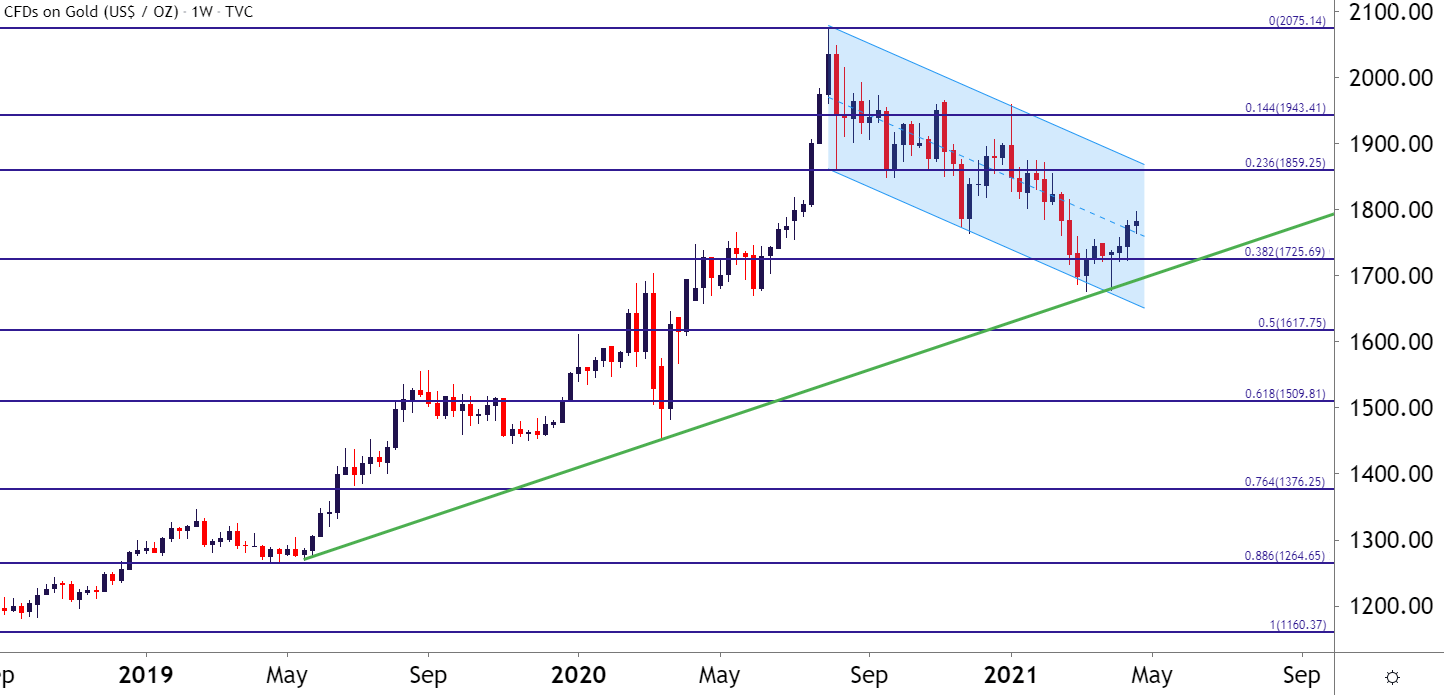
Chart prepared by James Stanley; Gold on Tradingview

Gold Breaks Neckline of Double Bottom
As looked at a couple of weeks ago, that tide started to show signs of turning when March price action saw the build of a potential double bottom formation.
A double bottom can be approached with the aim of bullish reversals, driven by the premise that the low price of rejection may lead to a further influx of bullish price action. These formations are often followed by looking for a breach of the neckline, or the high price between the two low prints, in the effort of looking for a bullish reversal.
That’s what’s shown so far with Gold prices breaching above the neckline of the formation, and continuing to push towards the 1800 psychological level.
To learn more about the double bottom formation, check out DailyFX Education
Gold Daily Price Chart

Chart prepared by James Stanley; Gold on Tradingview
Can Gold Bulls Spark a New Trend?
Now that Gold prices have put in a bit of strength to fill in that double bottom, the big question is whether bulls can continue the move to create a new near-term trend.
On the below chart, I’ve added a Fibonacci retracement over the pullback move, spanning from last August’s high down to the recent March low. Yesterday’s support showed up around the 23.6% retracement of that move, and the neckline from the double bottom remains in-play for higher-low support potential.
To learn more about Fibonacci, join us in DailyFX Education
Gold Four Hour Price Chart
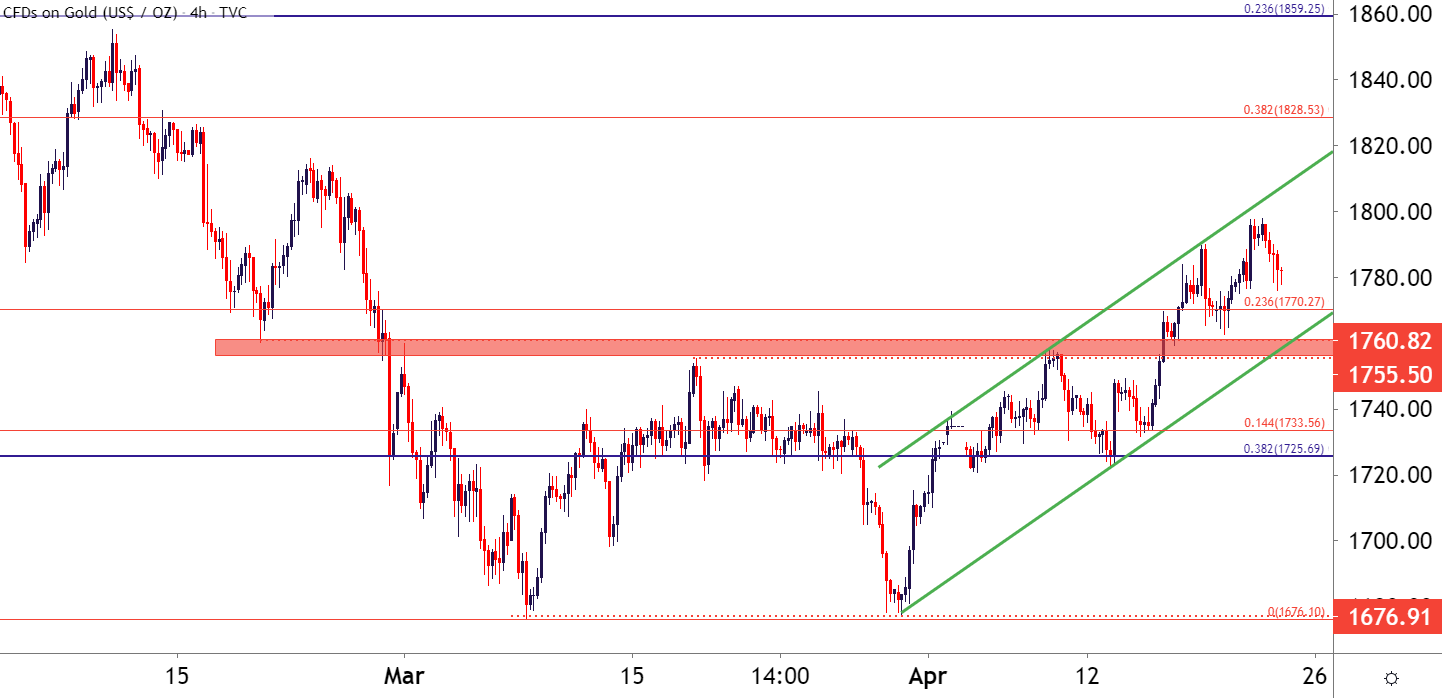
Chart prepared by James Stanley; Gold on Tradingview
--- Written by James Stanley, Strategist for DailyFX.com
Contact and follow James on Twitter: @JStanleyFX


