


Gold, GLD, GC Price Analysis:
• The Gold rally has continued and this week brought the first-ever breakout above the $2,000/oz level.
• That rally didn’t slow down at the psychological level, either, as bulls continued to press up to a new all-time-high of $2,075.14.
• A Friday pullback developed in what may have been position-squaring after a really strong bullish move extended through Thursday trade.
• Friday price action is currently showing as a bearish engulfing candlestick, which may lead to a continued pullback through early next week. The bigger question is what happens when price action finds support – will bulls make another pronounced re-entry? To learn more about candlestick patterns, there’s a full sub-module in the technical analysis portion of DailyFX Education section.
Gold Goes Haywire, Takes Out 2k And Doesn’t Look Back Until Friday
This week was yet another chapter in the bullish theme for Gold, which has put in an astounding run of as much as 78.9% in a little under two years. While the bullish theme is far from new, the aggression that showed up this week does seem to highlight a more recent scenario in which Gold prices have been strongly bid even in the absence of directly obvious drivers. While US Dollar weakness helps to explain at least some of the move coming into this week; the fact that the US Dollar spent the past five days ranging while Gold continued to shred to all-time-highs seems to indicate that something else is at work.
This bullish theme in Gold finally faced a bit of pullback on Friday, syncing with the NFP release that helped to prod a bit of strength into the Greenback. Prices pulled back, swiftly taking out the gains from Thursday trade and helping to create a bearish engulfing pattern on the Daily chart.
Gold Daily Price Chart

Chart prepared by James Stanley; Gold on Tradingview
Gold Prices Near-Term
Gold prices on a long-term basis are overbought; but that’s been the case for a while now and, at least so far, that’s mattered little. That’s not to say that a strong retracement may not be in the immediate future, but when the Friday bearish engulfing candlestick is taken in context with the bigger picture, there’s little reason to believe that this is anything more than a pullback at this point.
Bearish engulfing candlesticks will often be approached with the aim of continuation, given that we’ve essentially seen a course correction from a high down to a fresh near-term low. But, with a matter as overbought and built-in around Gold, the question must be asked for how long that pullback might continue before bulls step in?

This can open the door for a scenario of continuation in that pull back in the early portion of the week. The bigger question is what happens around support, of which there are a few possible areas of note. On the below four-hour chart, I’ve noted two potential zones of relevance. The nearest zone straddles that 2k psychological level and spans from a swing high at 1987.95 up to the Tuesday swing low of 2009.10. This zone remains especially interesting considering how price action just blasted through 2k without much of a pause and, to date, hasn’t checked-back for support around this price. The second deeper zone runs from the prior all-time-high of 1920.94 up to a batch of swing lows from last week around 1941.25.
Gold Four-Hour Price Chart
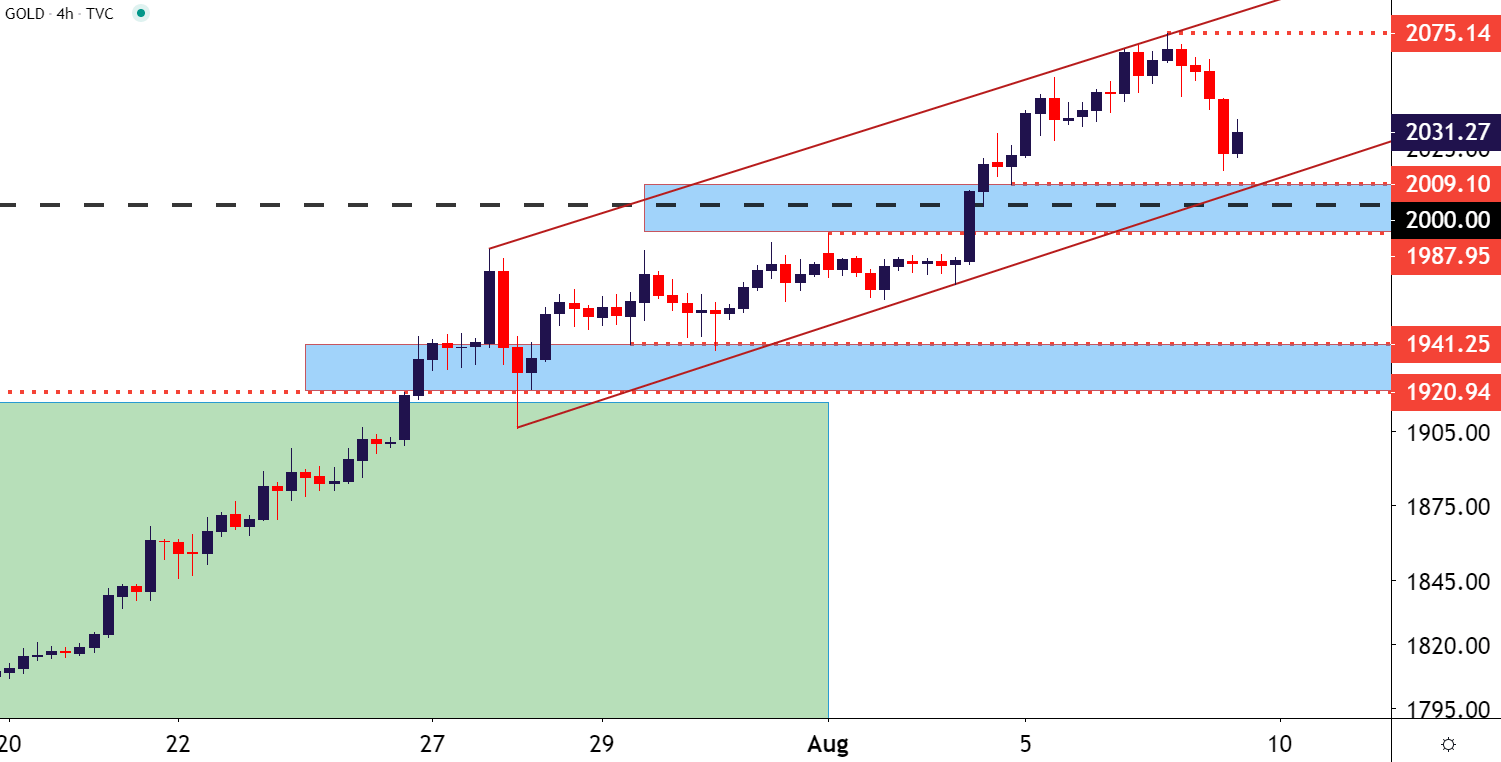
Chart prepared by James Stanley; Gold on Tradingview
Gold Prices – Bigger Picture
This has been a fairly popular theme on DailyFX over the past couple of years and Gold was my ‘top trade idea’ for this year; and I wasn’t alone as other members of the team had focused in on the yellow metal for this year. But, few could predict what would ultimately help to bring a mania-like move into Gold, as a pandemic in the early-portion of the year has led to some highly experimental monetary policy, which has benefitted Gold considerably.

Taking a step back and looking at the bigger-picture, the unchartered territory that we find ourselves in right now can make for difficulty in employing long-term technical analysis. There’s no historical data for prices north of 2k in Gold; and the last bullish theme of this nature, also driven by Central Banks, lasted for almost three full years.
So there’s considerable scope for projections and, unfortunately, there’s little data or evidence to back any of that up. So longer-term strategies may face challenges in this backdrop; at least until there’s somewhat of a bigger-picture pullback that could re-allow for bullish triggers. RSI on the Monthly chart of Gold looked at below is now at its most overbought since 2008, which showed up just ahead of the Financial Collapse. And while the response to the Financial Collapse ultimately ended up helping to drive Gold to that fresh high, there was a tough period in the middle of the collapse in which Gold prices shed almost a 1/3rd of their value (March-September 2008).
So, this is not an area for traders to get comfortable, even as the bullish trend in Gold has chalked up a new trophy by taking out the 2k figure on the run up to another fresh all-time-high.
Gold Monthly Price Chart

Chart prepared by James Stanley; Gold on Tradingview
--- Written by James Stanley, Strategist for DailyFX.com
Contact and follow James on Twitter: @JStanleyFX


