


Gold Price Forecast Overview:
- Good news for gold prices as Democrats’ wins in the Georgia Senate Runoff Elections increases the odds of more fiscal stimulus. US real yields have dropped, even as US Treasury yields have climbed higher.
- Gold prices have cleared the 38.2% Fibonacci retracements of the 2020 low/high range at1928.05, as well as the downtrend from the August and November 2020 highs.
- According to the IG Client Sentiment Index, gold prices may soon trade higher.
Gold Prices Teeter, but Good News Abound
Gold prices are trading weaker on the day in the wake of the surprising US Georgia Senate Runoff Elections, which yielded Democrats two wins and an effective majority in the Senate. Democrats now control the House, the Senate (vis-à-vis a tiebreaker from Vice President-elect Kamala Harris), and the White House. In a sense, gold prices are no longer a loser from the US presidential election, now that the composition of the Senate is known.
Long-term, this is good news for gold prices as Democrats’ wins in the Georgia Senate Runoff Elections increases the odds of more fiscal stimulus, which will push up the federal deficit and debt. US real yields have dropped, even as US Treasury yields have climbed higher, reflecting a rise in inflation expectations. With the Federal Reserve keeping interest rates low through 2023, the fundamental backdrop for gold just become a lot sturdier overnight.
Gold Prices and Gold Volatility Back in Sync
Historically, gold prices have a relationship with volatility unlike other asset classes. While other asset classes like bonds and stocks don’t like increased volatility – signaling greater uncertainty around cash flows, dividends, coupon payments, etc. – gold tends to benefit during periods of higher volatility.
Gold volatility has started to rise in recent days as trading volume has returned to the markets following the holidays, running right into significant event risk in the form of the US Georgia Senate Runoff Elections. Gold volatility (as measured by the Cboe’s gold volatility ETF, GVZ, which tracks the 1-month implied volatility of gold as derived from the GLD option chain) is trading at 22.14. The 5-day correlation between GVZ and gold prices is +0.98 while the 20-day correlation is +0.77; one week ago, on December 30, the 5-day correlation was +0.39 and the 20-day correlation was +0.23.

GVZ (Gold Volatility) Technical Analysis: Daily Price Chart (October 2008 to January 2021) (Chart 1)

Last week, it was noted (Are Gold Prices on the Verge of their Next Rally? Levels for XAU/USD)that “traders may need to wait until volume returns to markets in early-2021 to see if this gold price-gold volatility regime returns.” Now that the calendar has flipped to 2021, it may be the case that the historical relationship with gold prices and gold volatility is coming back into alignment. If so, falling gold volatility is not necessarily a negative development for gold prices, whereas rising gold volatility has almost always proved bullish; in the same vein, gold volatility simply trending sideways is more positive than negative for gold prices.”

Gold Price Rate Technical Analysis: Daily Chart (January 2020 to January 2021) (Chart 2)
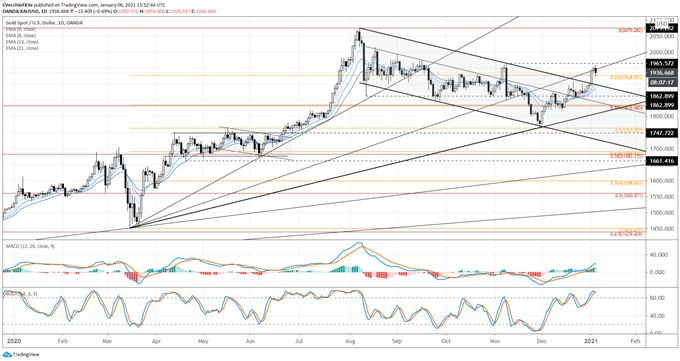
In the prior gold price forecast update, it was noted that “while the prevailing bull flag, denoted by the channel from the August and November highs drawn against the September low, has not been breached thus far, it remains the prime pattern we’re watching on gold charts.” Gold prices have experienced a bullish breakout from the descending channel/bull flag that we were monitoring throughout December. Gold prices have cleared the 38.2% Fibonacci retracements of the 2020 low/high range at 1928.05, but have not yet cleared the November swing high at 1965.57; break said level would be a very bullish development.
Gold prices are still above their daily 5-, 8-, 13-, and 21-EMA envelope, and the envelope is still in bullish sequential order. Daily MACD is still trending higher above its signal line, and daily Slow Stochastics are holding in overbought territory. The path of least resistance is higher, even amid some ‘buy the rumor, sell the news’ profit taking around the US Georgia Senate Runoff Elections.
Gold Price Technical Analysis: Weekly Chart (October 2015 to January 2021) (Chart 3)

Breaking the downtrend from the August and November 2020 highs as well as the 38.2% Fibonacci retracement from the 2020 high/low range suggests that the next leg higher is beginning. A move higher through 1965.57 would suggest that the series of weekly ‘lower highs and lower lows’ has ended. Weekly MACD is starting to turn to the topside while above its signal line, while weekly Slow Stochastics are racing towards overbought condition. Longer-term, consistent with our 1Q’21 forecast, gold prices look like they want to trade higher.

IG CLIENT SENTIMENT INDEX: GOLD PRICE FORECAST (January 6, 2021) (CHART 4)
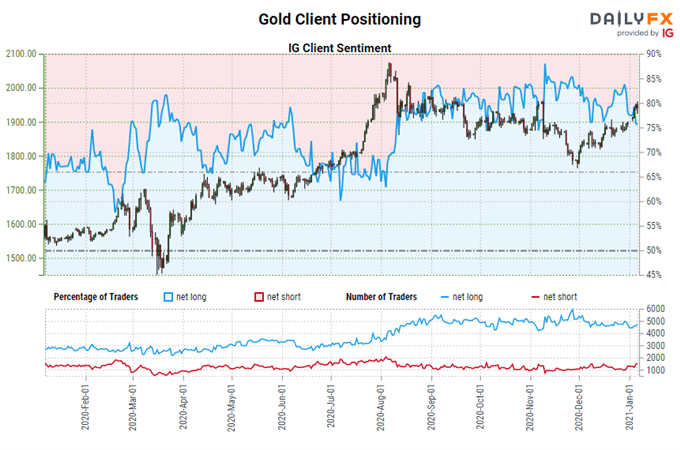
Gold: Retail trader data shows 74.89% of traders are net-long with the ratio of traders long to short at 2.98 to 1. The number of traders net-long is 3.12% lower than yesterday and 7.19% lower from last week, while the number of traders net-short is 7.78% higher than yesterday and 41.35% higher from last week.
We typically take a contrarian view to crowd sentiment, and the fact traders are net-long suggests Gold prices may continue to fall.
Yet traders are less net-long than yesterday and compared with last week. Recent changes in sentiment warn that the current Gold price trend may soon reverse higher despite the fact traders remain net-long.
--- Written by Christopher Vecchio, CFA, Senior Currency Strategist


