


Gold Price Forecast Overview:
- Gold prices are hovering below downtrend resistance, and recent shifts in key fundamental factors suggest that more gains may be ahead.
- Gold prices continue to trade between the 23.6% and 38.2% Fibonacci retracements of the 2020 low/high range at between 1836.97 and 1928.05.
- According to the IG Client Sentiment Index, retail traders are buying gold as prices rise.
Gold Price Action Remains Sturdy
Gold prices don’t have much to show through the first 48-hours of the week, trading effectively back at their open in New York on Sunday. Mixed news around US fiscal stimulus efforts – the $908 billion deal has been signed by outgoing US President Donald Trump, but the efforts to get a monthly payout of $2000 to most Americans was shot down in the Senate by Republican Majority Leader Mitch McConnell – has not given traders enough of a reason to stir significant price action in gold prices during the Christmas-New Year’s interlude. The bull flag remains the prime focus for gold prices as the year comes to a close.
Gold Prices and Gold Volatility Out of Touch, Still
Gold volatility has churned sideways in recent days, largely reflecting the lack of movement in spot markets around the holidays – typical behavior for this time of year. Gold volatility (as measured by the Cboe’s gold volatility ETF, GVZ, which tracks the 1-month implied volatility of gold as derived from the GLD option chain) is trading at 19.68. The 5-day correlation between GVZ and gold prices is -0.11 while the 20-day correlation is +0.14; one week ago, on December 22, the 5-day correlation was -0.44 and the 20-day correlation was +0.23.

GVZ (Gold Volatility) Technical Analysis: Daily Price Chart (October 2008 to December 2020) (Chart 1)
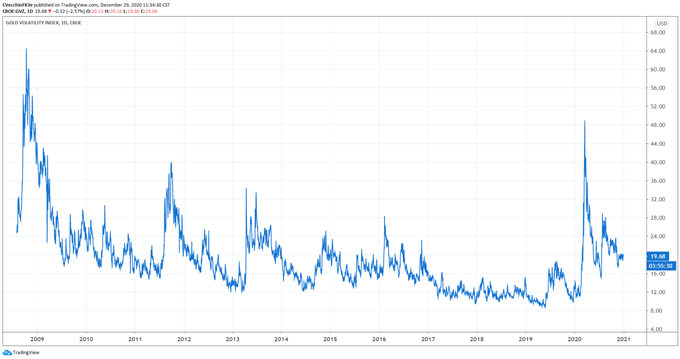
For the time being, it appears that gold prices and gold volatility remain out of touch, if it is understood that the historical relationship typically dictates positive correlations over the long-run. Furthermore, one of the tenets of this relationship in 2020 was that “falling gold volatility is not necessarily a negative development for gold prices, whereas rising gold volatility has almost always proved bullish; in the same vein, gold volatility simply trending sideways is more positive than negative for gold prices.” Traders may need to wait until volume returns to markets in early-2021 to see if this gold price-gold volatility regime returns.
Historically, gold prices have a relationship with volatility unlike other asset classes. While other asset classes like bonds and stocks don’t like increased volatility – signaling greater uncertainty around cash flows, dividends, coupon payments, etc. – gold tends to benefit during periods of higher volatility.

Gold Price Rate Technical Analysis: Daily Chart (December 2019 to December 2020) (Chart 2)
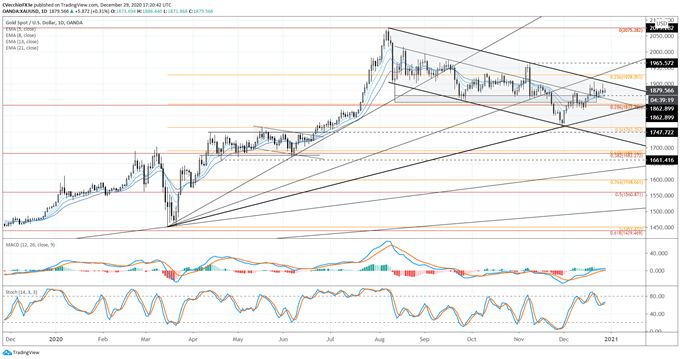
Gold prices are experiencing a quiet holiday week, as is typically expected during the Christmas-New Year’s interlude. Even with the bearish inverted hammer on the daily chart yesterday, gains today by gold prices have seen the market return back to its opening levels on Sunday evening in New York. It still holds that the technical structure has improved following breaching the evening star cluster high formed between December 8 and 10. While the prevailing bull flag, denoted by the channel from the August and November highs drawn against the September low, has not been breached thus far, it remains the prime pattern we’re watching on gold charts.
Gold prices are still above their daily 5-, 8-, 13-, and 21-EMA envelope, and the envelope is now in bullish sequential order. Daily MACD has turned higher above its signal line, and daily Slow Stochastics are moving higher back towards overbought territory. More patience may be required, but gold prices may soon gain traction.
Gold Price Technical Analysis: Weekly Chart (October 2015 to December 2020) (Chart 3)
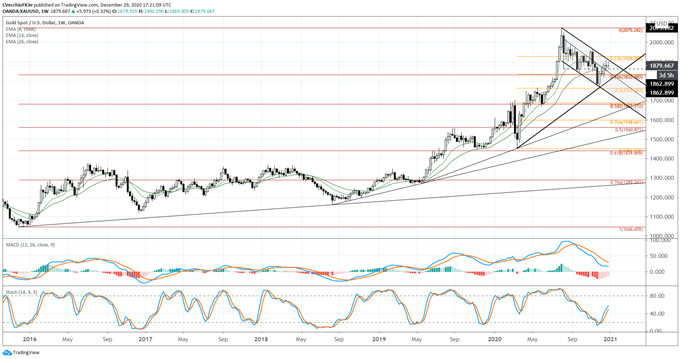
In the past three weeks, the downtrend from the August and November highs has not been broken. Gold prices are still trading between the 23.6% and 38.2% Fibonacci retracements of the 2020 low/high range at between 1836.97 and 1928.05. Trading above the former would suggest a bullish breakout to new all-time highs would be getting started, while a drop below the latter would open the door for a retest of the November low at 1764.57. A weekly inside doji candle following last week’s doji candle may not mean much in context of the lower volume markets during the holidays.

IG CLIENT SENTIMENT INDEX: GOLD PRICE FORECAST (DECEMBER 29, 2020) (CHART 4)
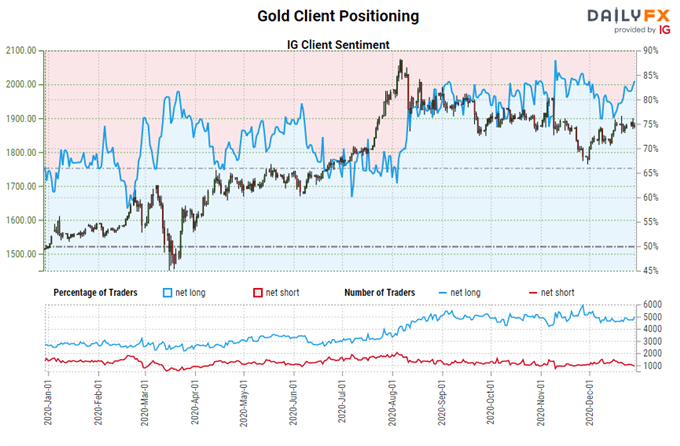
Gold: Retail trader data shows 82.80% of traders are net-long with the ratio of traders long to short at 4.81 to 1. The number of traders net-long is 7.27% higher than yesterday and 6.59% higher from last week, while the number of traders net-short is 7.26% lower than yesterday and 9.89% lower from last week.
We typically take a contrarian view to crowd sentiment, and the fact traders are net-long suggests Gold prices may continue to fall.
Traders are further net-long than yesterday and last week, and the combination of current sentiment and recent changes gives us a stronger Gold-bearish contrarian trading bias.
--- Written by Christopher Vecchio, CFA, Senior Currency Strategist


